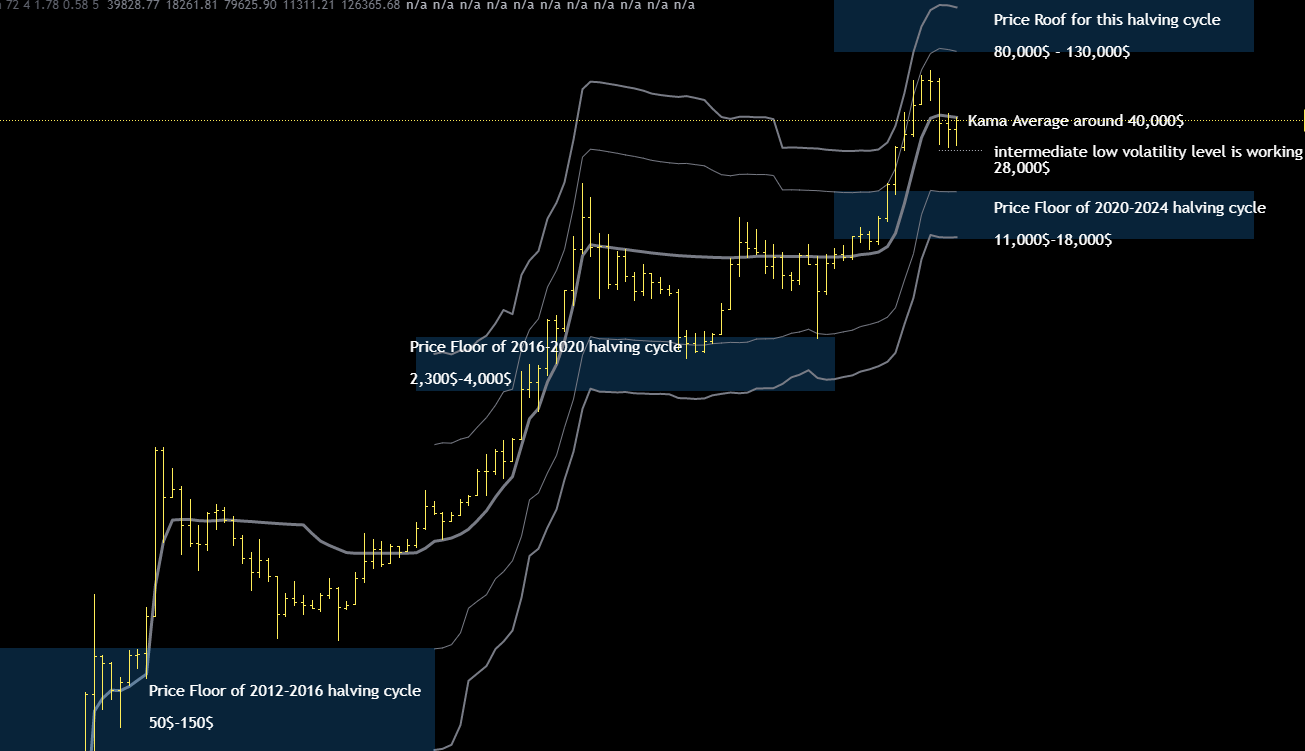
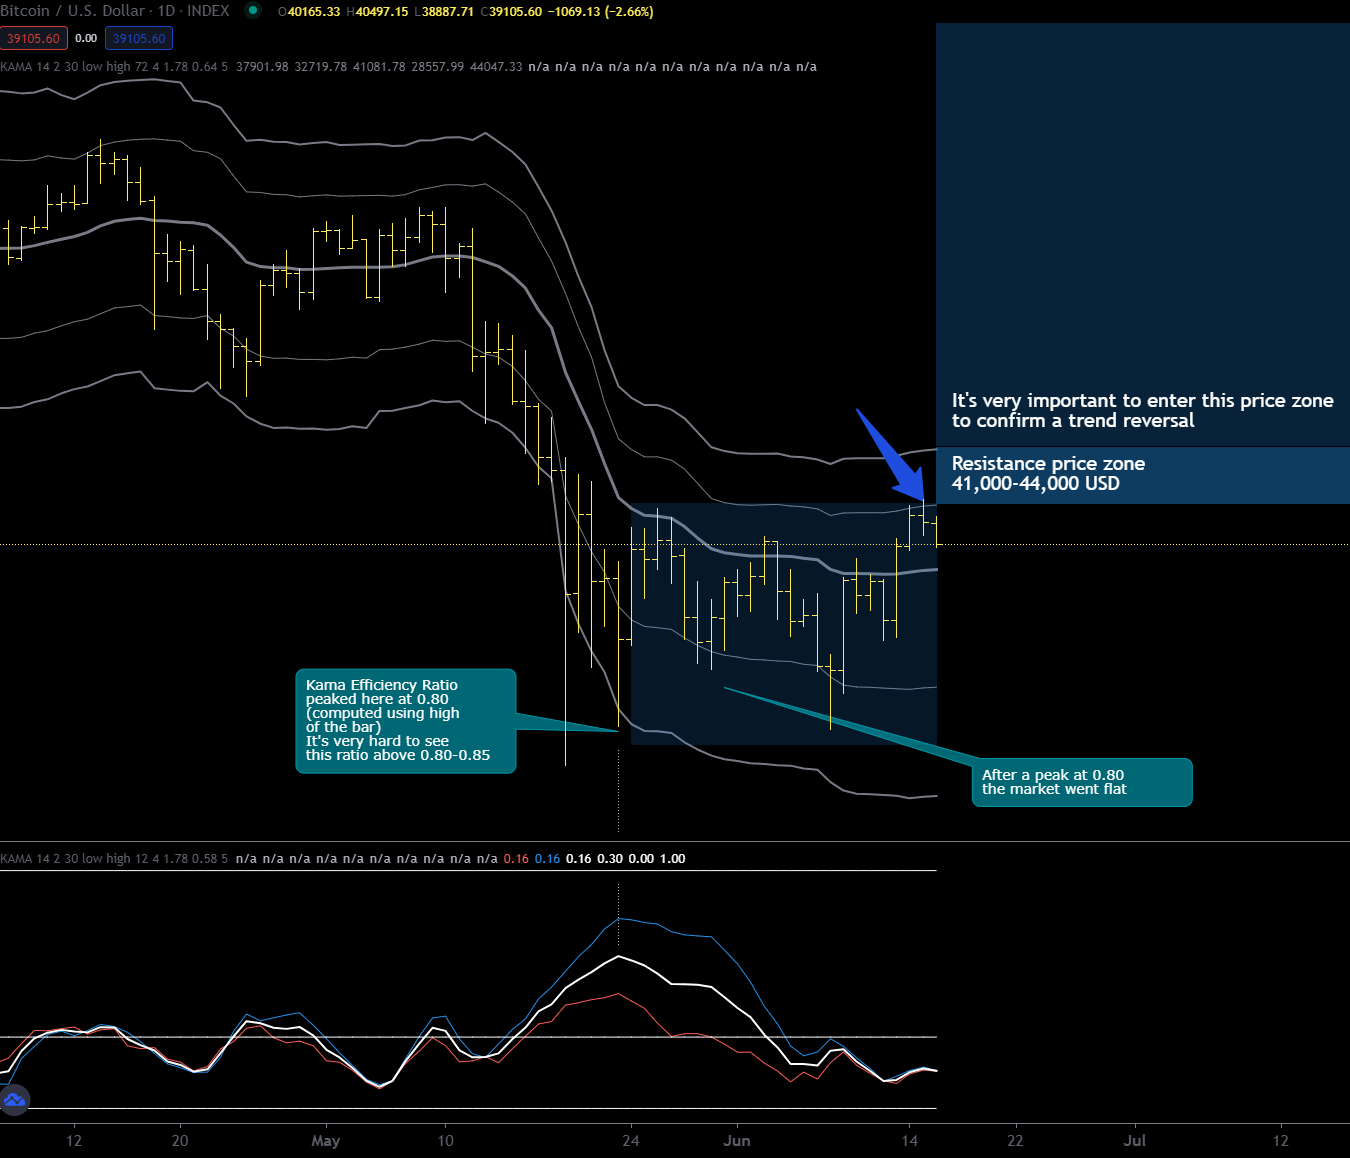
In the last update I had pointed out that it was crucial to exceed the monthly kama average (at that time around 40k usd), so bitcoin did and after a very strong bottom in July it resumed the uptrend on the monthly chart. Why a strong bottom? Because it was far above the support price zone defined by the lower bands.
At this point it is obvious that it will do a new top under the push of the ten-year old uptrend, after all bitcoin never entered a prolonged bear market since its inception.
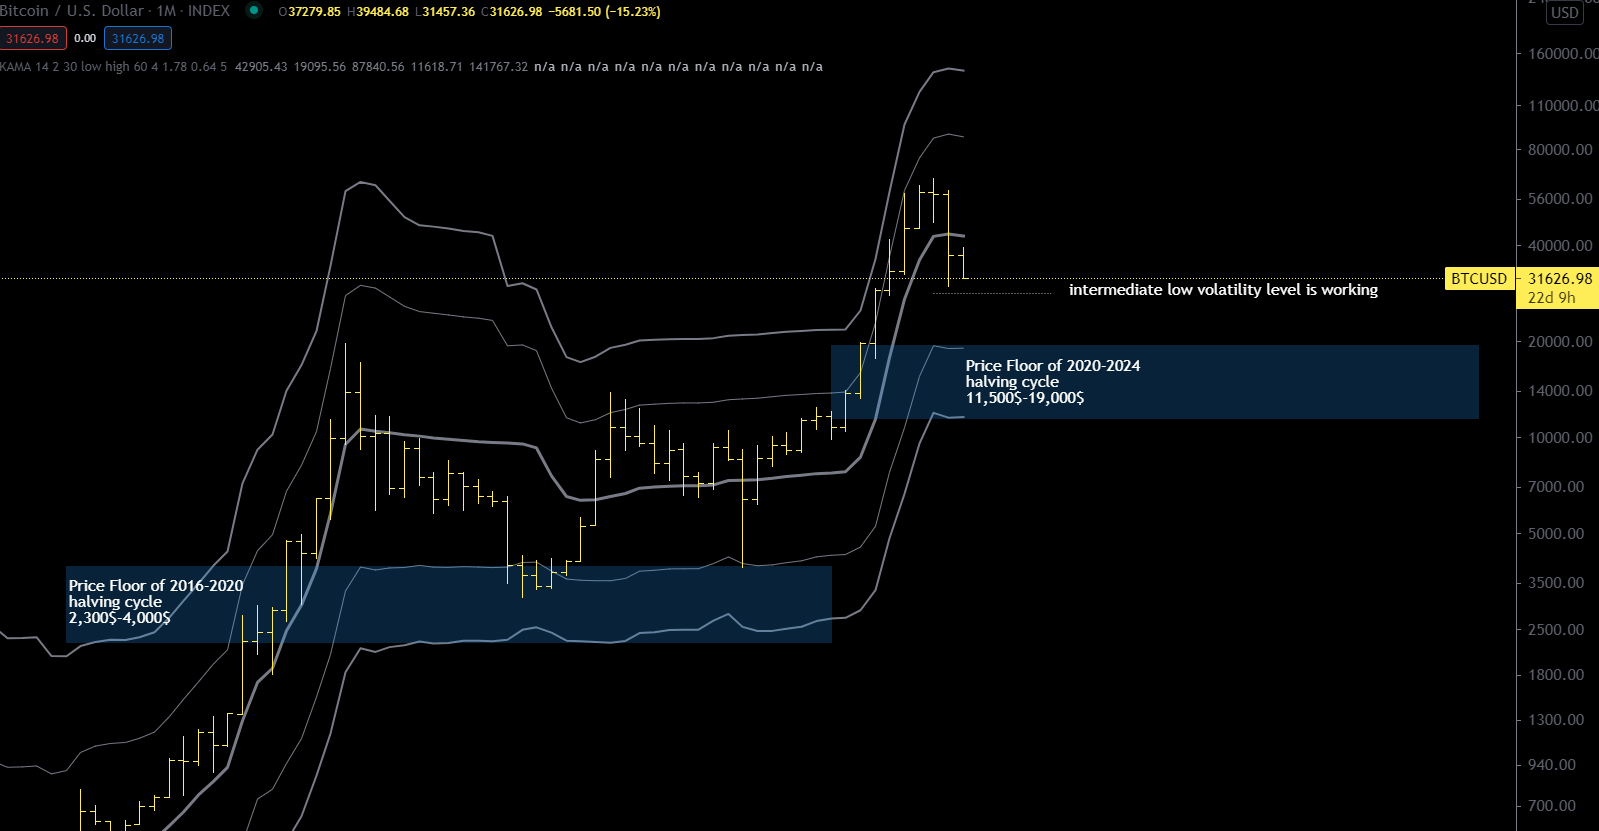
For quite some time now, thanks to the price bands, I have identified the price zone where the next top will happen, that is between 80 and 130 thousand dollars. This is the minimum target IF, and I emphasise IF, the monthly average kama will remain flat.
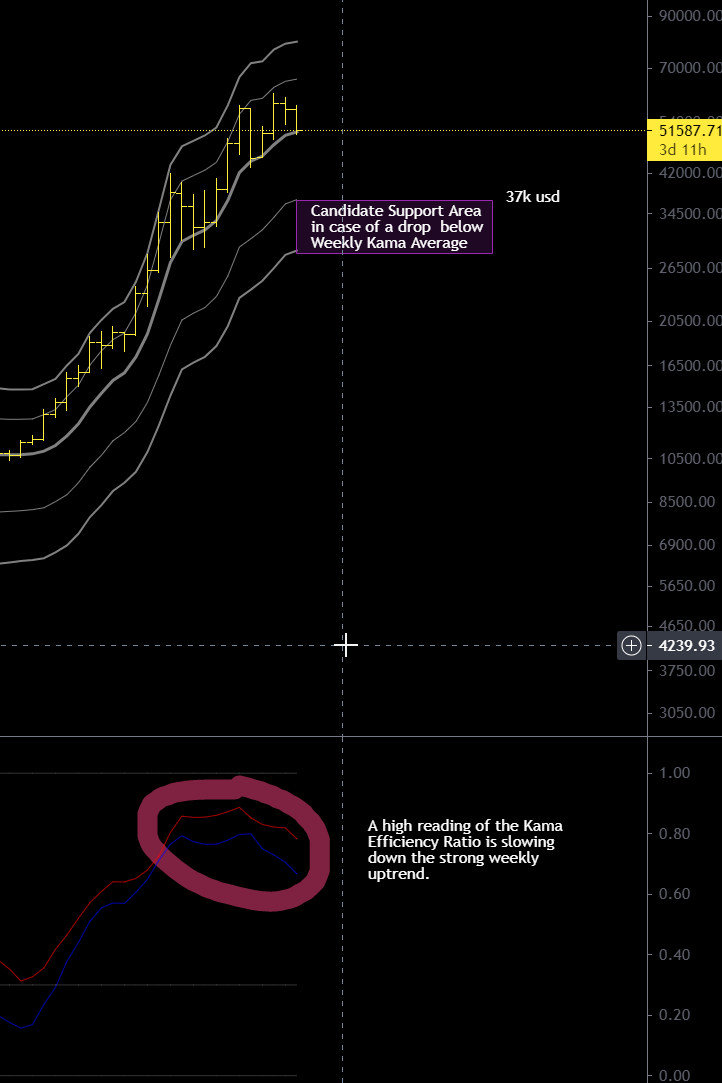
If you look at the attached chart you will notice that the monthly kama average is no longer flat but is going upwards, albeit slightly.

This fact should be kept in mind because the greater the upward slope of the average the lower the possibility that the bitcoin will stop in the resistance zone, if an asset is trending strongly you should forget the price bands.
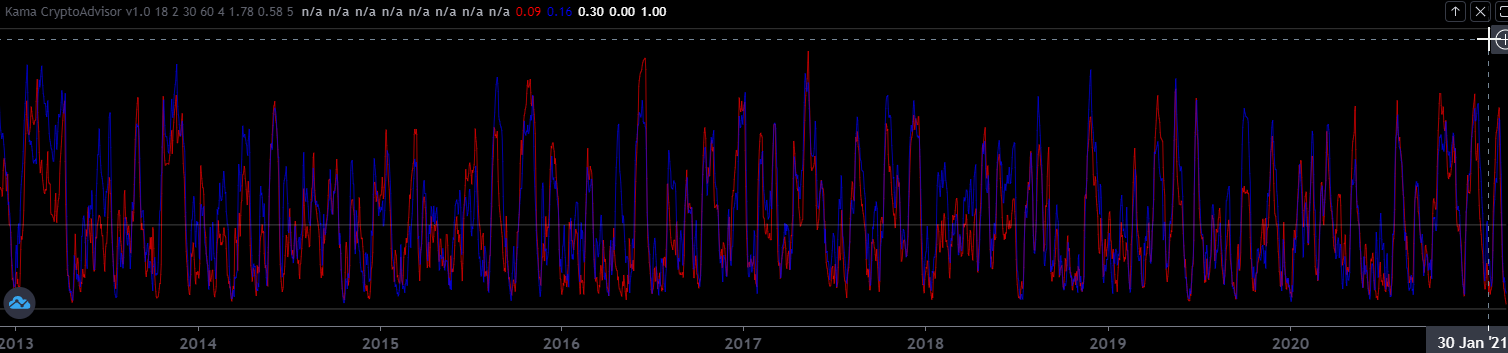
You may have noticed in the chart this aspect of the 19 months between the halving of the block and the market high, there are already two times that this market did a top within 19 months from the halving and in this cycle the expiry date is next December, the question then arises, will it work?
I think not, the market is never so symmetrical, we are talking about non-linear dynamics here that almost never lead to a strong symmetry or repetitiveness of price patterns, so I expect it to do something different this time and there are two possibilities, or that the maximum has already been done or that bitcoin will make another even beyond 19 months from halving, I am inclined to the latter possibility with the important implication that it might go above the price resistance zone.
How to translate this into your trading operativity? For the more risk averse you could evaluate a scaling down of the position at a point of your choice in the range 80k-130k usd. For all others you could use a dynamic stop loss like “chandelier exit” to try to exploit as much as possible the current uptrend. Search for “chandelier exit” or “chandelier stop” on tradingview, you will find many versions of this indicator.