
“…..on the daily chart where there is strong support but again it is a question of which timeframe will prevail and at the moment I would bet on the weekly chart, nonetheless there might be a minor rebounce from here….”
Last Update April 23, ’21
The minor rebound happened, market remained sideways around the daily average and came back down because of an accident (a tesla went off the road)
Let’s broaden the view with a weekly chart.
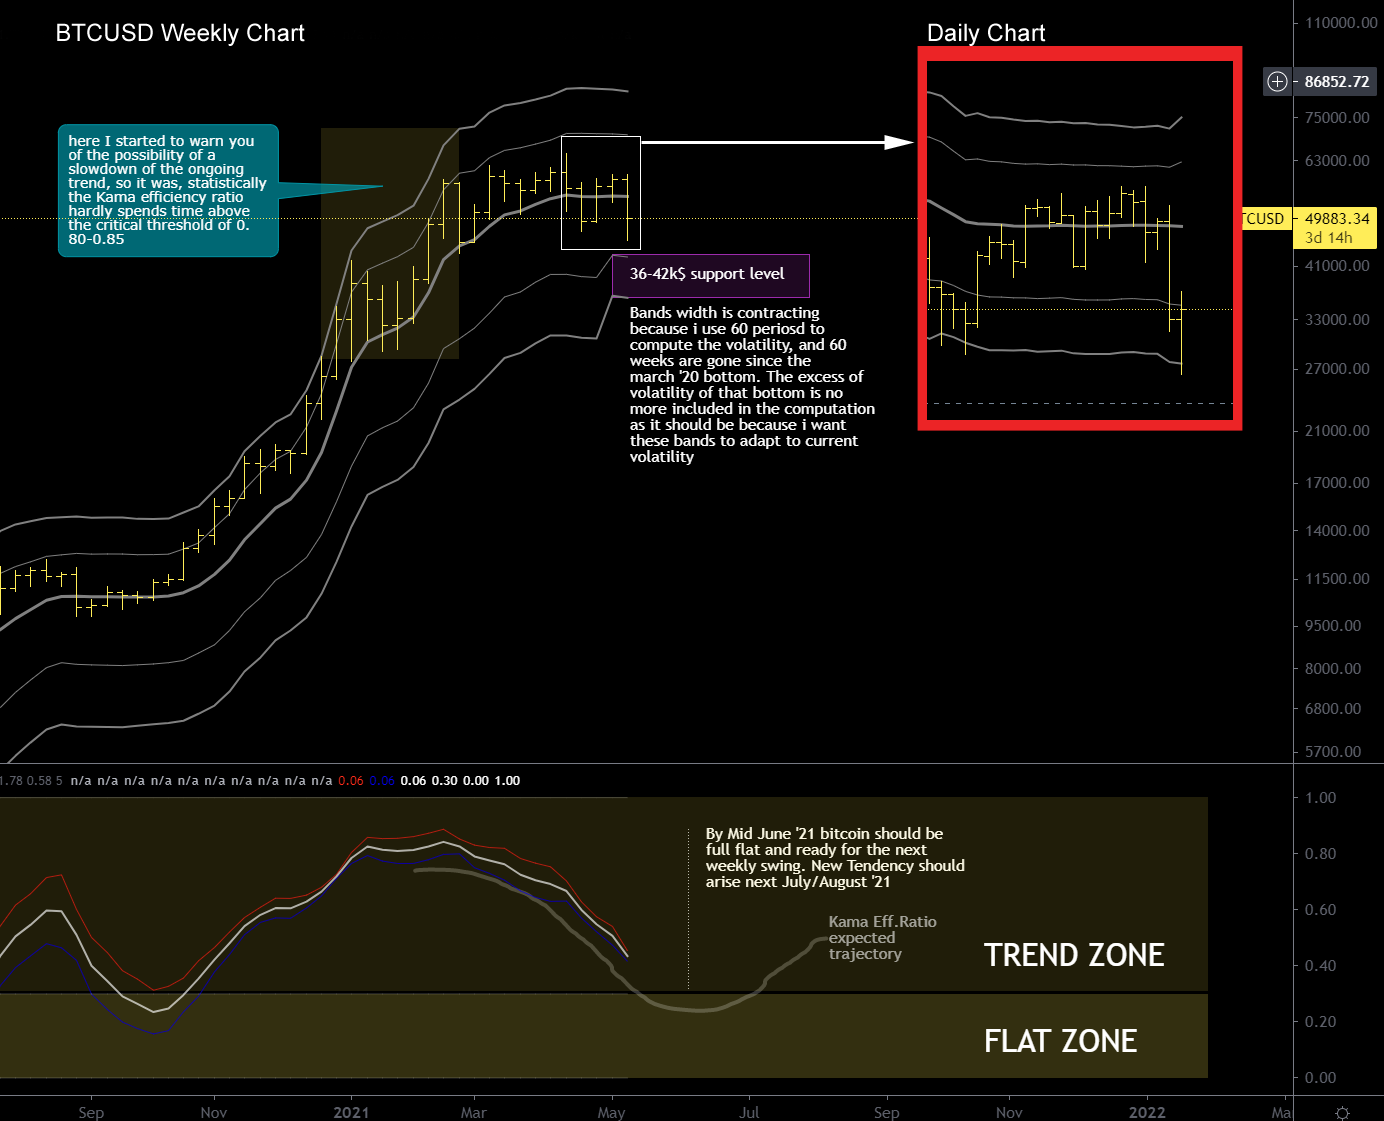
BTCUSD Weekly Chart – Below Kama Efficiency Ratio
Everything that has been happening since February 2021 which is the the slowdown of the trend on the weekly chart was expected and is the result of a careful observation of the volatility / trend ratio, two elements that characterize the average that I use (Kama)
I expect a further slowdown of the trend until mid-June when Bitcoin will be completely flat, from there on a new trend will emerge on the weekly chart; the future of bitcoin will be decided there should this new incoming trend be positive or negative (i guess positive).
A good idea could be to buy in the next week if bitcoin will test the weekly support zone in the 36,000-42,000 $ price zone, this market is lateral therefore I expect that it will not fall under 36000 dollars.
I think in July, I hypothesize, some liquidity may return to bitcoin from altcoins, also because the bitcoin market share chart (BTC.D on tradingview) has a nice spike in the kama efficiency ratio on the weekly chart (bottom might be near).
If a new trend is expected on the weekly chart for July let’s say, who could fuel this new trend? A return of liquidity from altcoins to bitcoin itself.
As usual if you have any doubts leave a comment, it is well appreciated.

Hi, great posts and analysis, thank you!
Quick question, do you do any analysis on Ethereum? Rob
>
Unfortunately yes, i often check ethbtc and/or ethusd for friends but i remain a Bitcoin Maximalist.
“a tesla went off the road” HA-HA That’s funny. 😀 I like your analysis, keep up the good work!
Great work as always. Question: I applied the tradingview Kama CryptoAdvisor v1.0 to my chart but it looks different than yours here. Did you change the parameters from the default ones?
Thanks!
no i use standard parameters, check that the indicator is tied to the right y axis otherwise the bands will looks odd of they are tied to the left y axis.
Hi,
Do you expect a further drop into the 36-42K support zone from here?
Cheers for all your time and analysis 🍻
Honestly dunno, it’s hard to say if the top of this cycle is in or not. If the top is in then for a new ATH we have to wait the next halving cycle, after 2024.
A 64k usd top is in my opinion a bit low, i was expecting at least 120k, if 36k usd will not hold then it’s probably over, in this case support should be around 20k usd or the old 2017 top.
Thanks for your reply! My favorite BTC blog.
Thanks for continuing your work. Have been following for many years since using sierra chart.
I ditched Sierrachart a while ago, neverthless is a good trading platform, because it was very hard to code your own indicators. I’m only using tradingview at the moment.
Thanks for the update and your continuous work! Intense drop, seems like 36k broke..? Do you still have your trailing profit at 29k (mentioned March 31)?
Cheers