I was saying in the last update that a bottom on the Kama average (daily chart) is a high and strong bottom, which suggests new highs coming.
This is not happened and usually, I emphasize usually, if after a relatively high bottom we do not have a new top what happens is that it may develop a sustained decline and is exactly what has happened in recent days.
This behaviour in my opinion can be explained by the situation on the weekly chart that i already pointed out in the long term update of last January 19, 2021.
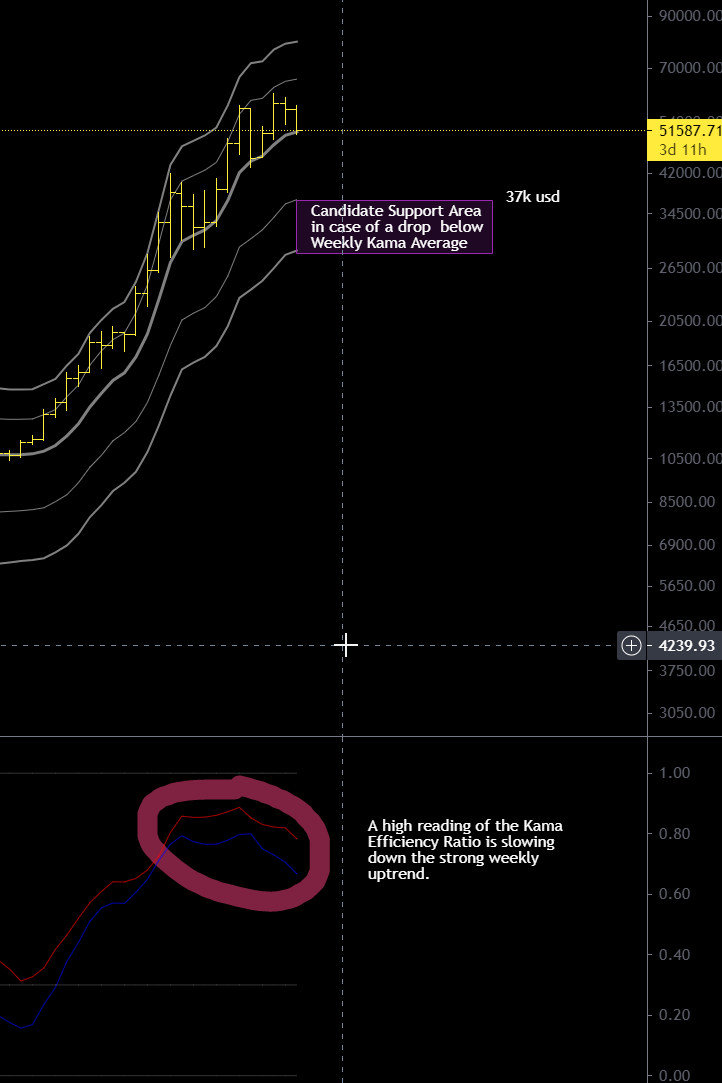
In the chart below you can see that once arrived around 0.85 the kama efficiency ratio has begun to decline slightly, the consequence on the graph is a slowdown of the weekly trend in progress.
I do not think that the consolidation phase of the Kama ER (eff.ratio) is over, therefore the risk is that the lower part of the bullish channel might be tested, with the first support at 37 thousand dollars and the next at around 29 thousand dollars.
This risk of a drop exists and could materialize in the coming weeks, therefore the operating strategy requires a change, the stop loss that I once suggested at $35,000 could be too close and should be moved below $29,000 to remain protected from the volatility of this market. You don’t want to get caught by the market at the bottom and then see the train leave without you on board:)
Stay alert and lucid because a good buying opportunity could be coming, between $29K and $37K. It’s crucial to see if these days BTCUSD will stay or not above weekly kama at 51,000$