
Every year i post an outlook using entropic methods explained in the technical section of this blog. Here you can find the 2015, 2016, 2017, 2018, 2019, 2020, 2021, 2022, 2023, 2024 and 2025 forecast update, where you can find more information about this approach.
Updated values for bitcoin (in brackets values of 2025) using daily data since August 2010 (from now on I will use only BITSTAMP data, as today there are not many differences between major Bitcoin exchanges.).
| BTC/USD | |
| Growth Factor G | 1.00094 (1.00099 ) |
| Shannon Probability P (see this as entropy) | 0.5217 (0.5295 ) |
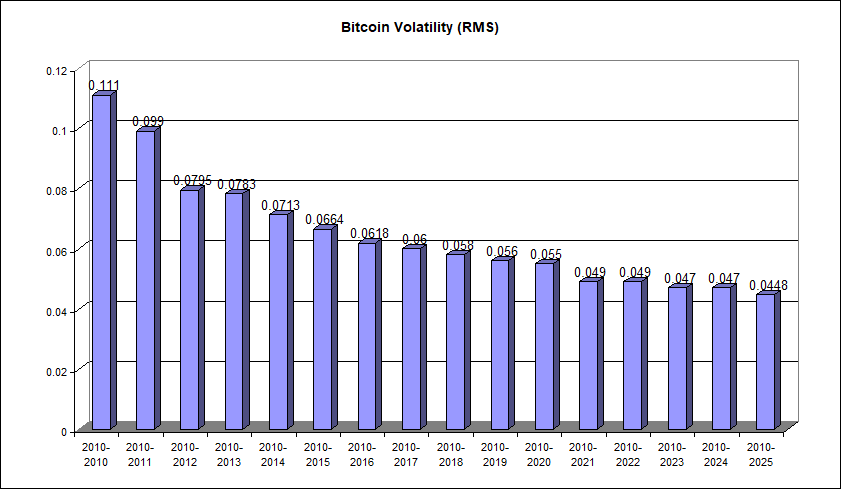
| Root mean square RMS (see this as volatility) | 0.045 (0.047) |
The entropy levels of Bitcoin against the USD showed no improvement in 2025. The Growth Factor (G) dropped a bit to 1.00094% daily compounded, equivalent to about 41% annually. The optimal portion of your total wealth to allocate to Bitcoin is now 4.3% (~0.5217*2=1.0434 – 1 = 0.0434 or ~4%) and it went down a bit due to a flat year.
“For those who may have forgotten, the Shannon Probability measures the persistence of Bitcoin’s price movement, indicating the likelihood that the asset will experience a positive trend. A value of 0.52 suggests that, out of 100 days, Bitcoin is likely to show an upward movement on 52 days, and either a decline or no significant movement on the remaining 48 days.”
Bitcoin’s historical volatility dropped slightly this year, the only positive development amid otherwise challenging data, and aligns with expectations for a maturing asset in terms of capitalization. However, as noted in updates over the past two years, the pace of decline has slowed considerably, and volatility remains substantially higher than that of other assets, underscoring Bitcoin’s persistent nature as a highly speculative investment.
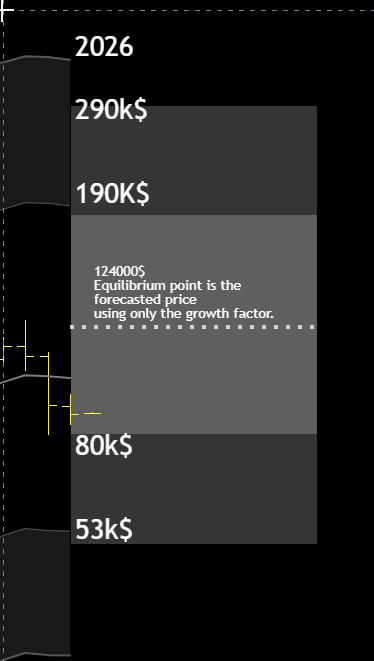
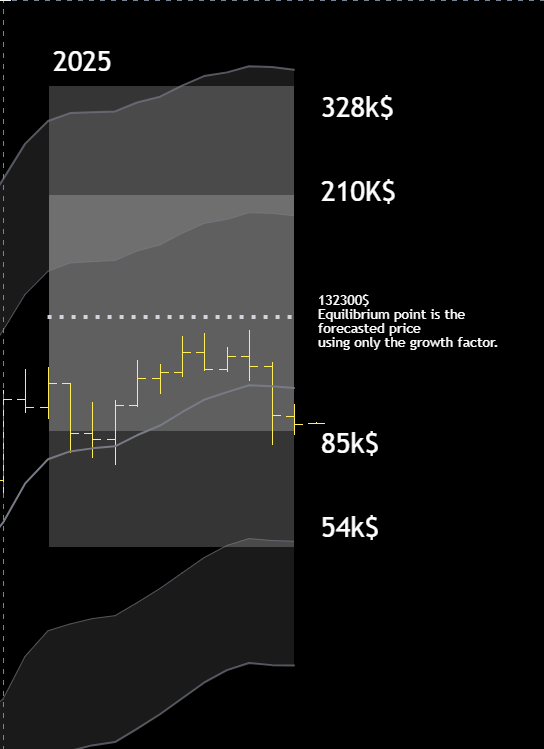
| 2026 Price forecast | Full Historical Volatility | Half Historical Volatility |
| Forecast using only G* or Growth Factor | ~124,000$ | ~124,000$ |
| Upper bound adding volatility | ~292,000$ | ~190,500$ |
| Lower bound subtracting volatility | ~52,700$ | ~80,800$ |
*124,100 $ is obtained with 1st January as a starting price (around 87890$) times (1.00094^365)=~1.41 | 87890*1.41=~124000$, just change 365 with the number of days you prefer for a different forecast.
What happened in 2025?
Conclusions
After holding my long position for nearly three years, initiated in February 2023 at approximately $22,500, this is a good moment to reassess the risk/reward profile at current levels.
The 2025 data tells a nuanced story, while Bitcoin delivered positive returns, the entropic indicators showed marginal deterioration. The Growth Factor declined and Shannon Probability dropped , these aren’t alarm signals, but they suggest that the statistical edge has weakened a bit compared to when I entered the position.
At current prices around $88,000, I’m sitting on roughly 290% gains. My approach for 2026 is conditional.
If $80,000 breaks down decisively, I will take profits. This level represents both the lower bound of my half-volatility forecast and a psychologically significant threshold. Even at $80k, I’d be locking in approximately 255% gains, a reasonable exit after a historically strong run.
My reentry target would be the $50,000–55,000 zone. This area aligns with both the full-volatility lower bound at $52,700 and my monthly KAMA deviation bands.
On the other hand, if $132,000 breaks to the upside, I will hold and reassess at the upper bound levels. This is not a bearish call, it’s risk management after a successful multi-year trade. The data doesn’t justify aggressive positioning in either direction at these levels.
Feel free to reach out with any questions, and I’ll see you in the next update. Happy New Year!
Charts

Happy New Year, Enky! All the best in 2026 for you and family. Thanks for sharing.
Are you still believe in 4 year bitcoin cycles? And if yes, could we confirm that in current cycle Bitcoin top has been set at ~125k?
Hard question. Generally when a pattern becomes common knowledge among the investors it stops working.
As for 125k being top of the 4y cycle feels early to call. No blow-off, no retail mania yet. Looks more like a local top than a cycle top.
Hi Enky!
Thank you for another yearly analysis. What I find interesting this time is that entropic indicators showed deterioration. We are seeing such thing for the first time, right?
I also thought BTC would have another leg up. But it is what it is 😉
Happy New Year!
No it happened also in 2014, 2018 and 2022, all post bubbles years.
Happy New Year to you too and thank you again, you’re really great!
Thinking about the past year – and I’m not very technical, it seems to me that KAMA is very useful for getting the key price levels, but cycle analysis is equally important for gettting the approixmate timing of the big moves. Although many people were laughing about that 4chan meme with the BTC cycle dates, the top came exactly on October 6th as predicted. It’s not unreasonable to think the bottom of the bear market will be this fall.
And you know there is cycle analysis in stocks and the general economy also, it can be applied to any signal, it’s not just a BTC thing. Seems pretty real, hard to explain why though.
We’ll see if the cycle is confirmed in 2026. Looking forward to reading you on X! Cheers and all the best!
Happy New Year and thanks for the kind words.
You make a good point about KAMA vs cycles. I see them as complementary: KAMA tells you where price is likely to find support or resistance, cycle analysis tries to answer the when question. Different tools for different jobs.
The 4chan prediction is interesting. The guy posted his model back in December 2023, something like 1064 days from bear lows to tops, and called October 6th almost perfectly. Hard to ignore. That said, survivorship bias is real: for every prediction that goes viral because it hit, there are probably hundreds that missed and nobody remembers.
Why do cycles seem to work? Probably some combination of halving-induced supply shocks, the way human psychology operates on roughly 4-year memory spans, and self-fulfilling prophecy once enough people start trading the pattern.
Here’s the thing though: markets are non-linear systems. Once a pattern becomes common knowledge, it starts to break down. If everyone is positioning for a fall 2025 bottom, that collective expectation changes the game. People front-run each other, and the cycle shifts or disappears. The 4chan prophecy going viral could be exactly what kills it.
Anyway, we’ll see how it plays out. Thanks for following and all the best for 2026.
Happy New Year, Enky. Riding the Bitcoin train since 2013 as a permahodler and accumulator. We survived Mt. Gox, Silk Road, China bans, hard forks, and FUD. Never lost faith. Now gradually taking profits to grow wealth over the years during bull cycles and to make a comfortable life. Following your blog and insights has helped me not to panic, stay patient, and make rational decisions. It has been worth the wait.
Frank,seems many long-standing holders have started slowly taking profits in 2025. I wonder why now? How psychology works? Or has enough time simply passed since 2010’s and this is more trigger than the price? Could you explain your thoughts/expectations please…
I cannot speak for all long term hodlers, but this is my personal opinion. It doesn’t have to be a sudden psychological shift, nor does it have to be purely about price. It’s more a combination of time, contentment, and acceptance.
The foundation for me lies in being comfortable with an average standard of living and in understanding the principles behind Bitcoin its vision, its invention, and the fact that it solves a fundamental problem in money and trust. Materialism isn’t the driving force; freedom is. More specifically, the kind of financial freedom where money is no longer a constant concern.
That freedom doesn’t mean excess. It means that if something breaks, it can be replaced. If a vacation is desired, it can be booked. If going out for dinner feels right, it’s possible. If a comfortable car is needed, it can be bought ( without Lambo thinking). Not extravagant, but comfortable.
That level of sufficiency naturally leads to patience, a long-term perspective, and the ability to ignore years of noise and fear.
Over the past years Bitcoin has largely delivered on what was once hoped for. The network has proven itself, grown, and matured. At a certain point, that success brings realism not driven by fear or doubt, but by responsibility.
As Bitcoin’s value has increased significantly, dealing with taxes, regulation, and increasingly complex systems becomes unavoidable. Gradually taking profits fits logically within that reality, without abandoning belief in the invention itself.
As Enky once said: “a trade has to end at some point.”
That end doesn’t come from panic, but from contentment, acceptance, and making practical use of what long-term patience has produced.
Taking profits over time isn’t abandoning belief, it’s responsibility because every trade eventually ends.
Good morning Enky,
Thanks for another great yearly post. Followed you since 2011 and even though I’m still not that technical I’ve learned a lot from you and the community about trading psychology in general which I’m eternally grateful for.
What are your thoughts about the 80k barrier mentioned in this post? Are you taking profit, or have you reconsidered after your new power law model mentioned on X/twitter?
All the best,
phel
Thanks phel, much appreciated!
The $85k figure in the blog post is the model’s predicted cycle bottom. In the new power law analysis I posted on X, the key difference is timing because I now think the cycle bottom hasn’t happened yet. My working hypothesis is that the real top is still ahead ($250k, late 2026 or early 2027), followed by the bottom ($85k) around mid 2028.
So I’m not taking profit here this analysis reinforces my long-term conviction.
Keep in mind that short-term volatility could push Bitcoin down to the fair value line (blue line on the chart), which currently sits around $43k. That would be a buying opportunity, not a reason to panic.
Thanks for answering. Your new model is compelling and glad to hear that you’re trading accordingly!
As you’re saying a drop to those levels seems rather like a buying opportunity indeed.
Hi Enky,
How do you analyse from a fundamental perspective, with BIP-110 and attack on Core, your new power law analysis? Bitcoin ecosystem “feels” like 2017 all over again (Block size war). If UASF activates in September 2026, it’s difficult to see new all time high in 2026 ($250K). If BIP-110 activates could easily see 25-30K dollar price or even lower.
Agree with your timing for bottom mid 2028, but is your new power law analysis invalidated when we bottom mid 2028 at 30K?
(Local)Top of 126K in October was moment when Knots-Core debate really started.
Note also, that Bitcoin has never traded for a long period of time below 200 week moving average. If it drops again to the fair value line (blue line on your chart), which currently sits around $43k, 200 week MA is rounding and possibly starting to decline for first time in Bitcoin’s history.
Thank you for your blog and that you keep it updated!
Herbert
Hi Herbert,
I’d say my power law model is effectively broken. At most, the OU process on the residuals (the difference between price and the long-term power law baseline) still applies. I see $38K as a hard support falling below that permanently would break the framework.
A quick dip to $30K wouldn’t invalidate it, but lingering under $38K would.
Aniway I’m already working on a replacement approach to eliminate the power law in my model.
what’s the outlook for bitcoin in 2026 using those entropic methods? 🤔
Hi, as of now bitcoin has already broken my initial 2026 forecast: it reached a low of $60,000 on Feb 2 and is currently around $68,000. The support zone at 80–90K didn’t hold, confirming that the market is weaker than expected. I’m reassessing risk/reward and watching for potential lower support near $53K.
Hi Enky
I’ve recreated your entropy approach as a TradingView indicator. The numbers are slightly different, probably due to the 5,000-bar limit on the free plan, so this indicator is based on about 14 years of data. Also, it’s possible you calculate them a bit differently—let me know if that’s the case, and I’ll fix it. Thanks for your blog!
https://www.tradingview.com/script/MQ1u6Kbb-RMS-Shannon-Probability-G-Yield/
Hi, interesting work on the RMS / Shannon / G Yield indicator. I built something very similar back in 2017 (“Enky Quantitative Tools”) and noticed a few structural differences that might be worth considering:
1. Single channel vs dual channel: your version uses close only, while mine tracks high and low separately, giving independent bull/bear readings for P and G. This provides more information about directional asymmetry in volatility.
2. Rolling window vs cumulative from anchor: you use ta.sma over a lookback window, I accumulate from a user-defined start date. Different use cases, but the cumulative approach lets you study a specific regime from a known starting point.
3. Compensation always on: in my version the -1/sqrt(t) bias correction term is optional (toggled by input). Useful to compare corrected vs uncorrected readings.
4. Hardcoded annualization: you raise G to the 365th power, which only works on daily charts. My version uses an input parameter for the exponent, so it adapts to any timeframe.
5. No price bands: the projection formula close[t] * exp(t*log(G) ± rms*mult*sqrt(t)) is missing. That’s arguably the most actionable output of the whole framework.
The core math (RMS of log-returns, Shannon probability mapping, geometric growth rate) is the same. Just different design choices around it. Thought you might find the comparison useful.
I compute using all data for my blog yearly update because of the 5000 bars limitation. Tradingview is not good for my needs.