
We are flat, usually it happens so the market finds a strong point (where the indicator of efficiency of kama average reaches values around 0.80-0.85) and stops, at that point it can go in lateral or bounce noticeably.
In most cases we enter in a lateral phase which is now defined by the usual bands that I use (see chart below).
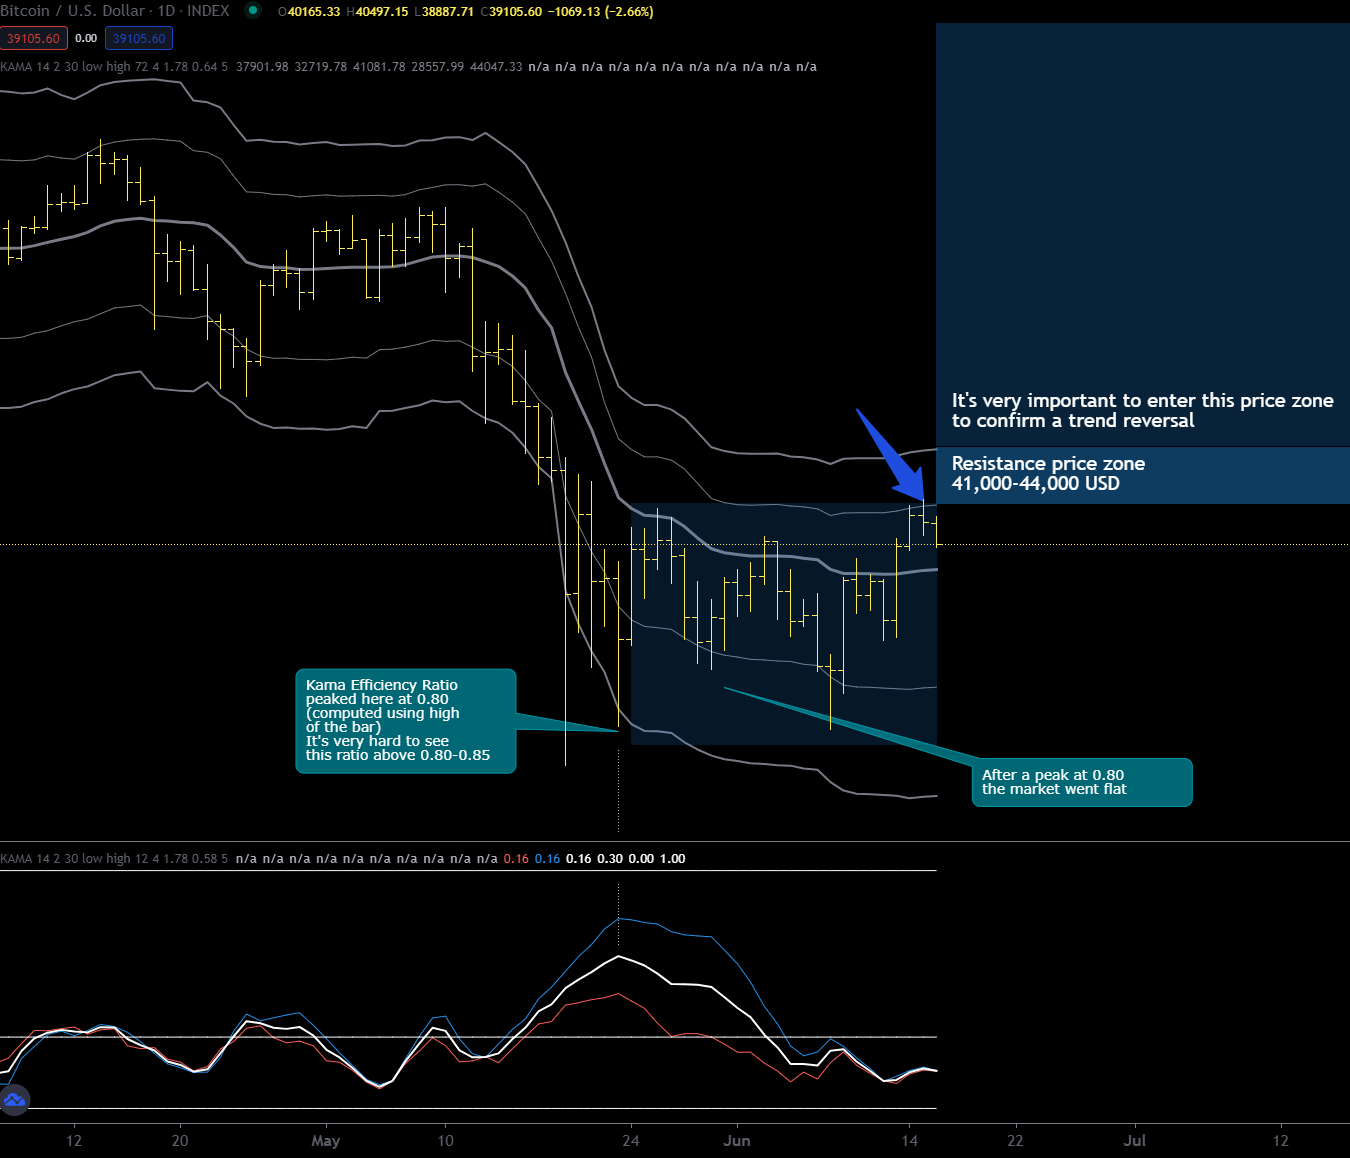
What i’d like to see is:
- Some consolidation above daily kama average, >38,000$
- A first breakout of the first resistance band at 41,000$
- A test of the 2nd band at 44,000$
- Some healthy retracement back to 41,000$ or so
- Final break-out above 44,000$
This could be a good recipe for a trend reversal on the daily chart.
38,500$ is not only the daily kama average but also the 2nd support band on the hourly chart, i’d like to see bitcoin above it these days during a possible accumulation before to break above 41,000$.
Fix in your head that as long as we stay below $44,000 (by the way it is also the monthly Kama average) my view remains bearish.
