Crash Update: How many Periods to use?

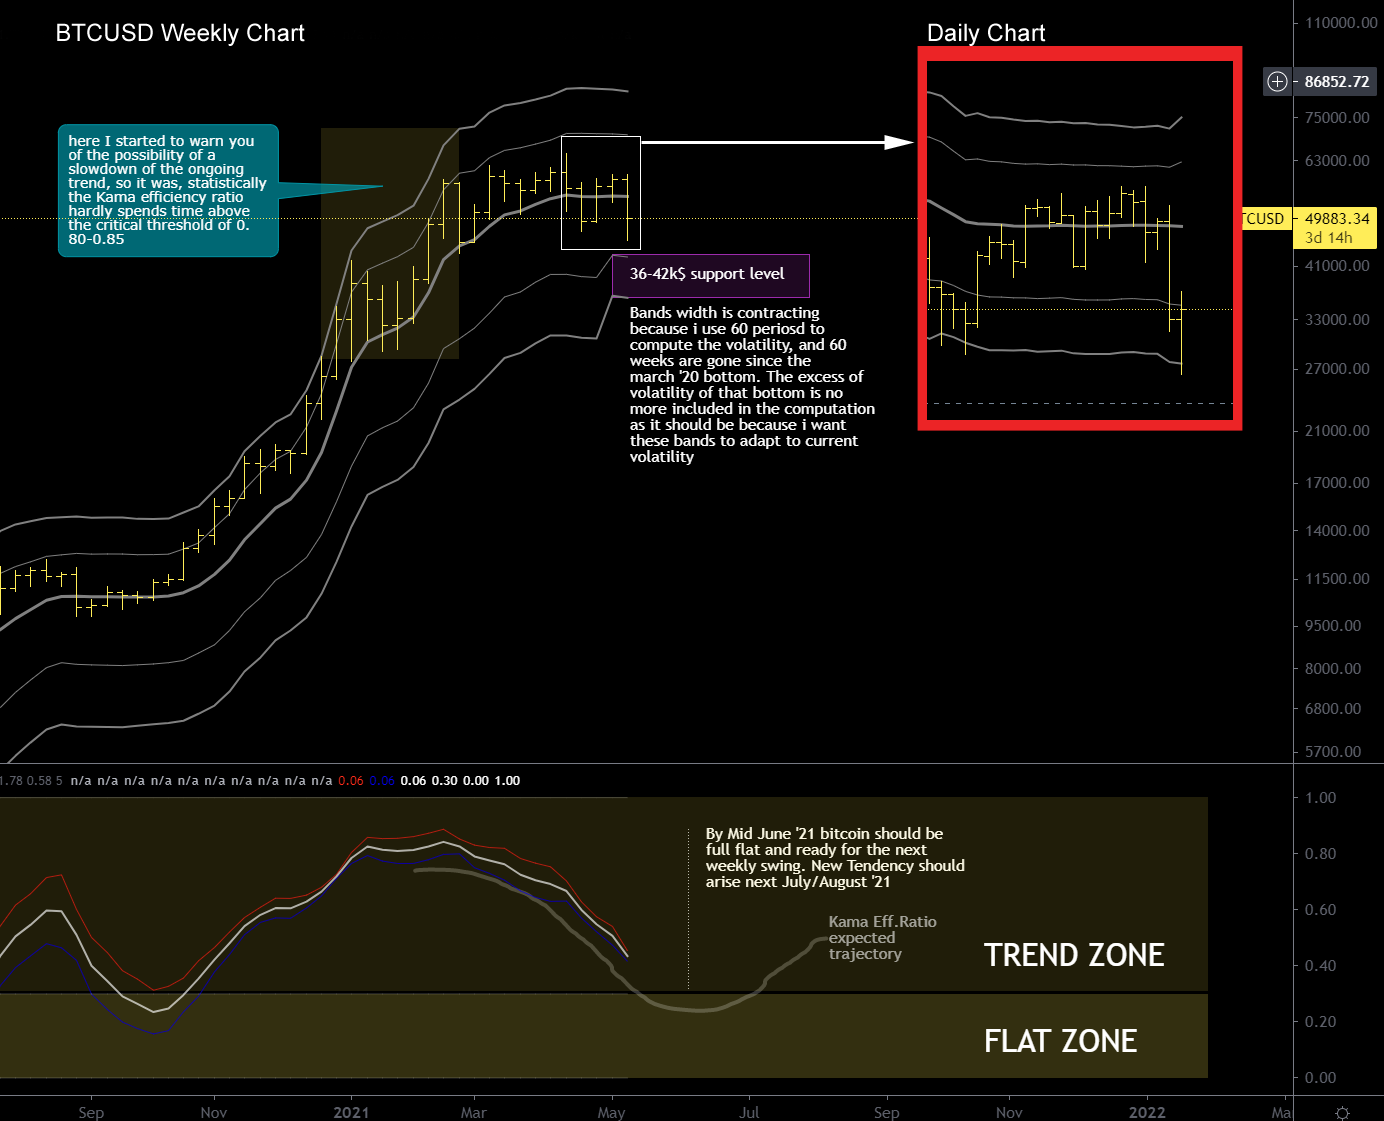
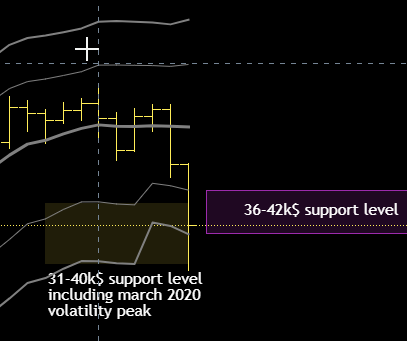
I’m writing this update to do a clarification to the analysis posted the other day, as I had said the support range of the price bands that I use had contracted a bit giving me an area of support of 36-42 thousand dollars, why this? Because I use 60 periods to calculate volatility and more than 60 periods or weeks have passed since the minimum of March 2020 where there was a correction similar to this one, therefore the volatility peak recorded in that bottom of last year is no longer included in the calculation.

Hence the question “How many period to use?” is legitimate, in some cases is smart to fine tune the indicator parameters to better accommodate what is happening (an increase of volatility).

For those who use my indicator with tradingview can verify what i’m saying by themselves by increasing the setting “rms periods” from 60 to 70 for example.

Having said that, the support zone is thus corrected to around 31-40 thousand dollars and I would say that for now it has worked quite well, this means that we are still in the limits and that a trend reversal on the weekly chart is not yet confirmed, so far we are just seeing volatility at work.

We will have to wait until the end of this week and next week to better evaluate the ongoing correction to check if bitcoin price will remain above 31000$ or not.

BTCUSD Weekly Chart

Long Term Update: No more Tesla.

“…..on the daily chart where there is strong support but again it is a question of which timeframe will prevail and at the moment I would bet on the weekly chart, nonetheless there might be a minor rebounce from here….”

Last Update April 23, ’21

The minor rebound happened, market remained sideways around the daily average and came back down because of an accident (a tesla went off the road)
Let’s broaden the view with a weekly chart.

BTCUSD Weekly Chart – Below Kama Efficiency Ratio

Everything that has been happening since February 2021 which is the the slowdown of the trend on the weekly chart was expected and is the result of a careful observation of the volatility / trend ratio, two elements that characterize the average that I use (Kama)
I expect a further slowdown of the trend until mid-June when Bitcoin will be completely flat, from there on a new trend will emerge on the weekly chart; the future of bitcoin will be decided there should this new incoming trend be positive or negative (i guess positive).
A good idea could be to buy in the next week if bitcoin will test the weekly support zone in the 36,000-42,000 $ price zone, this market is lateral therefore I expect that it will not fall under 36000 dollars.

I think in July, I hypothesize, some liquidity may return to bitcoin from altcoins, also because the bitcoin market share chart (BTC.D on tradingview) has a nice spike in the kama efficiency ratio on the weekly chart (bottom might be near).
If a new trend is expected on the weekly chart for July let’s say, who could fuel this new trend? A return of liquidity from altcoins to bitcoin itself.

As usual if you have any doubts leave a comment, it is well appreciated.