I left you on March 31 saying that bitcoin would probably go up with less intensity, that’s what it did by making a new top around Coinbase’s Nasdaq listing event.
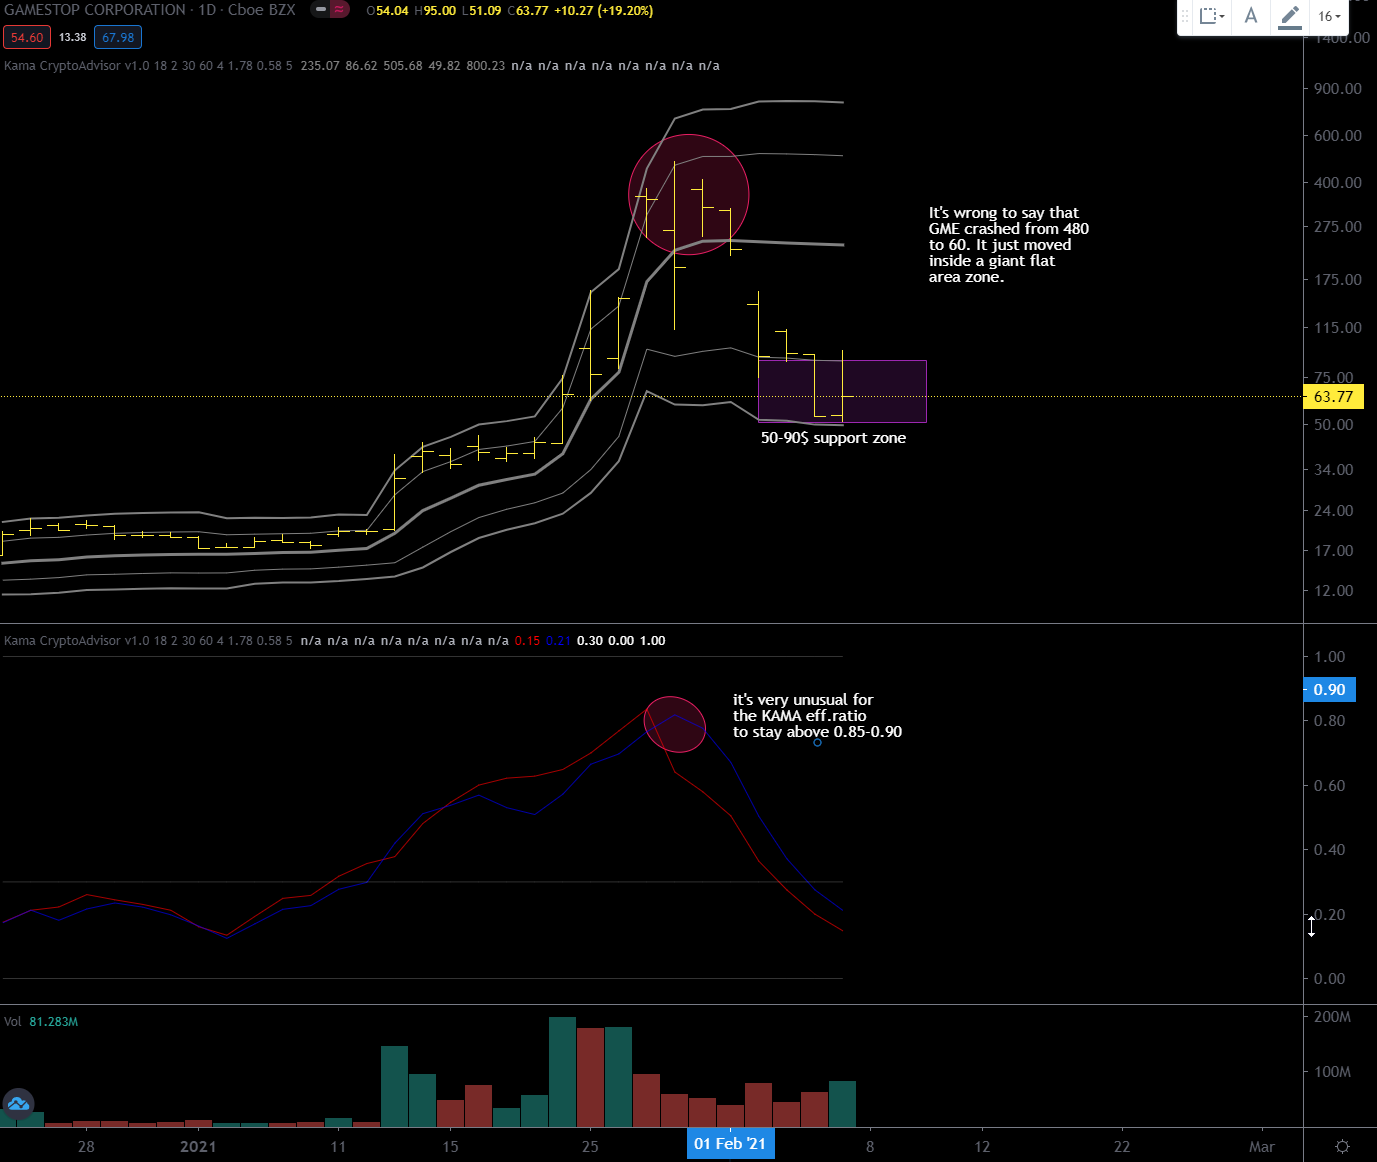
It can happen that such events that catalyze the attention of the entire community can mark what I call “buying climax” remember that the main feature of such an event is when you run out of demand around a highly anticipated news or event like the Coinbase listing.
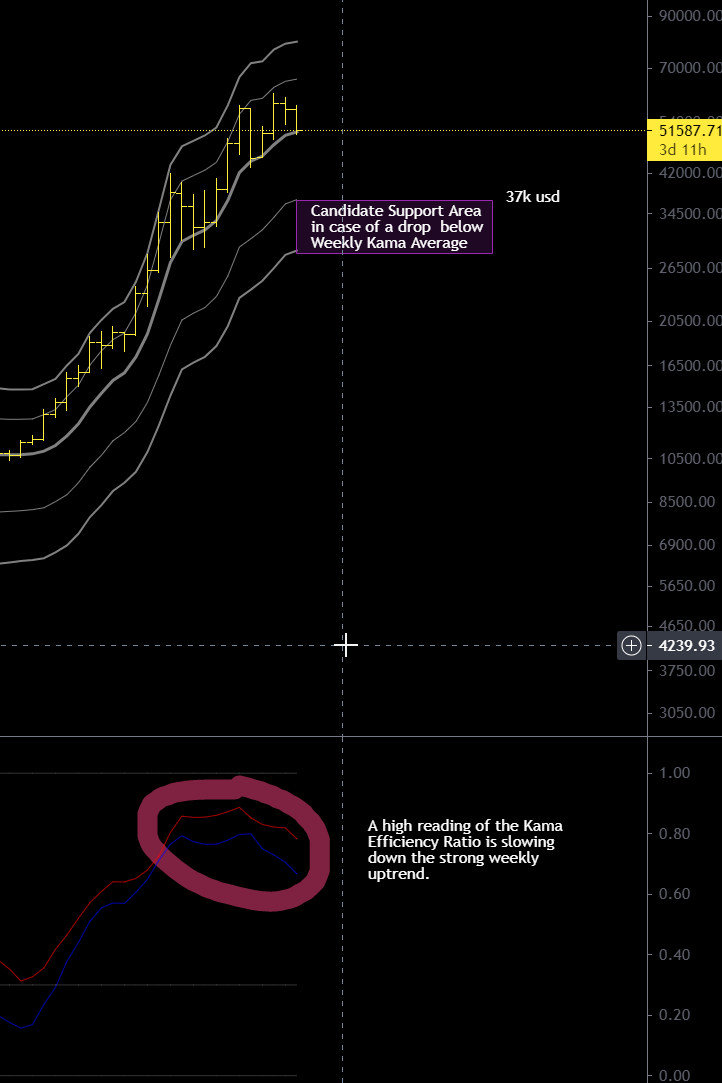
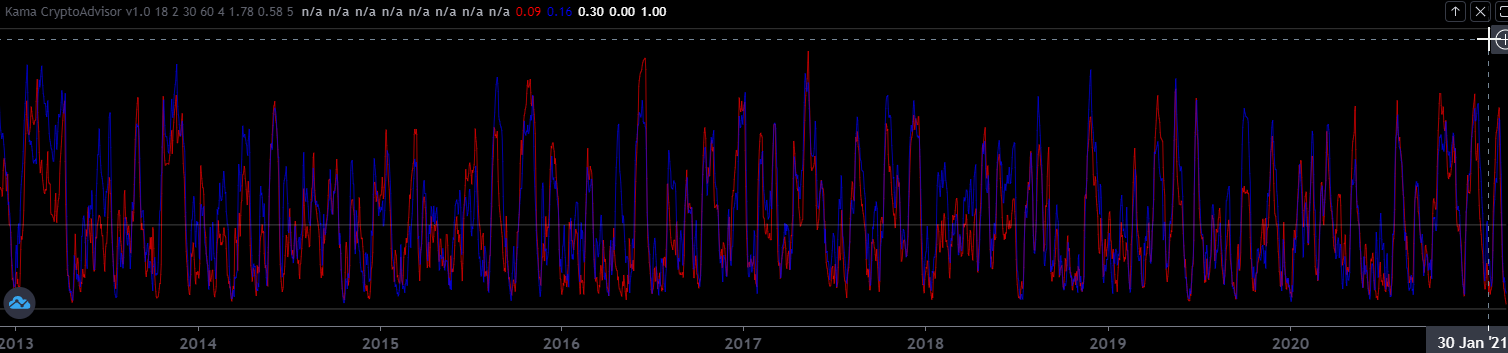
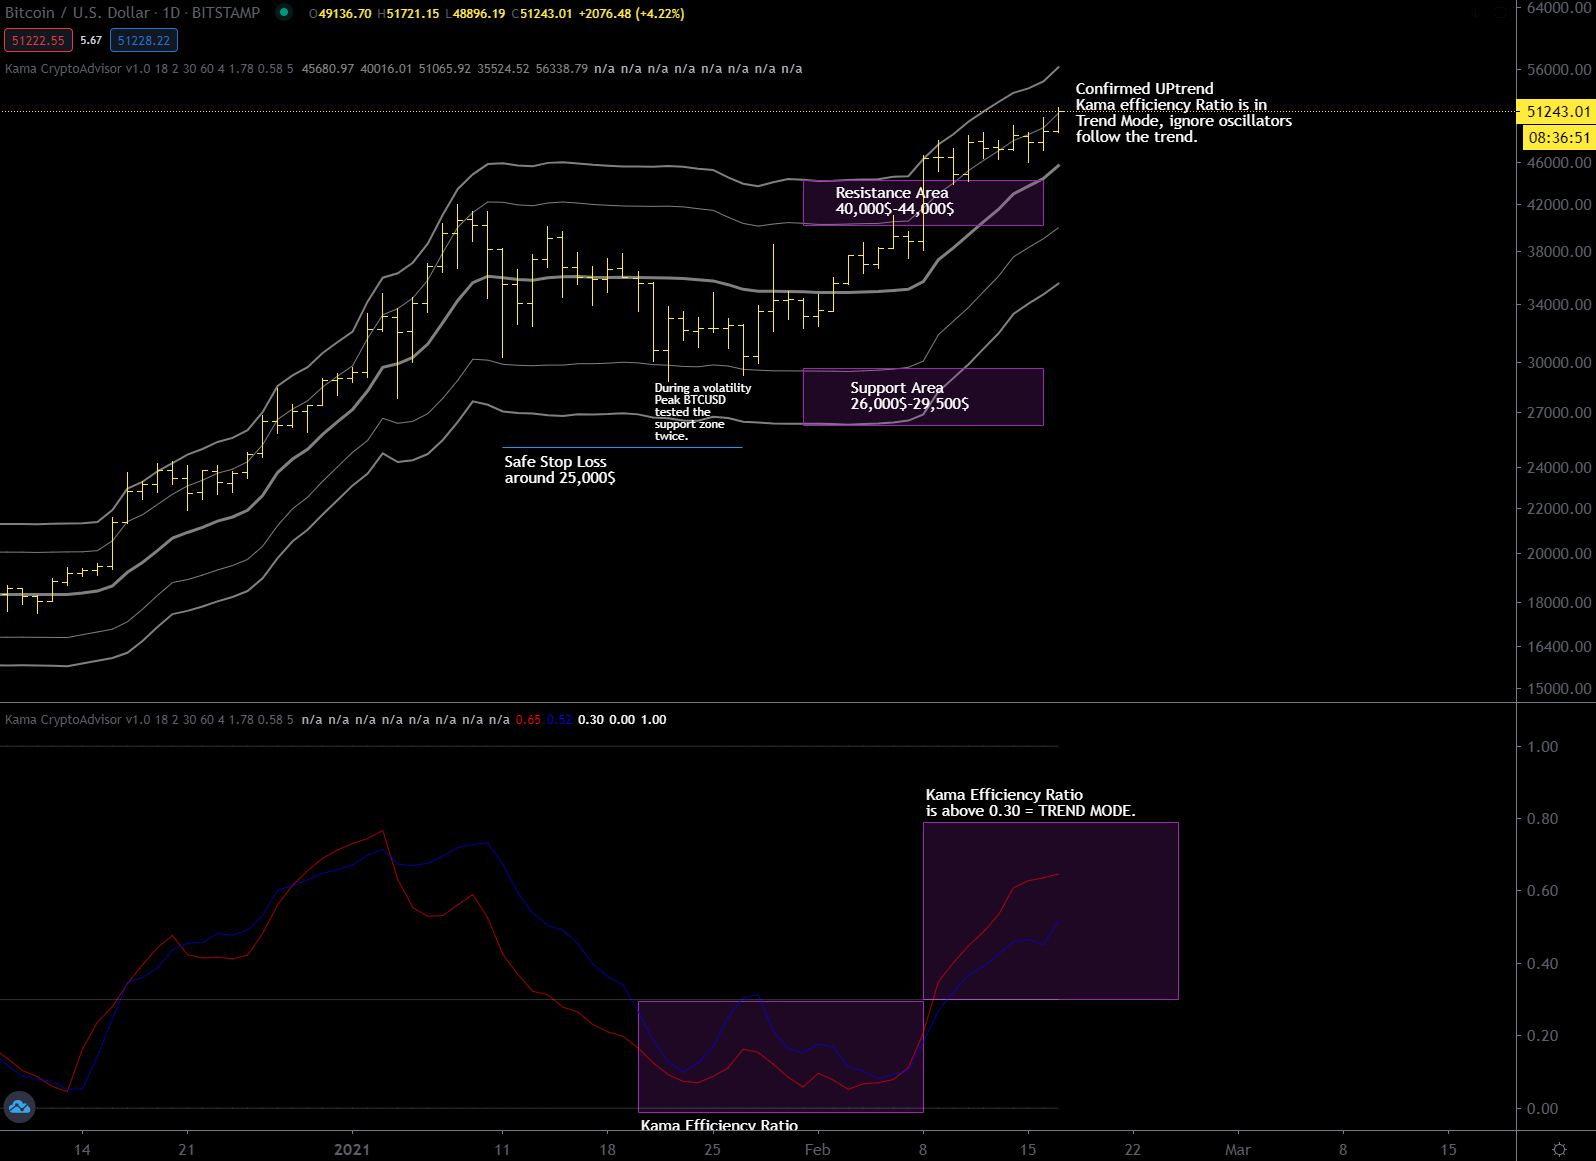
The situation on the weekly chart has remained unchanged, I’ve been telling you for two months that the Kama efficiency ratio is high and needs to go down and that’s what it keeps doing, today we got to about 0.59 and I think it will continue to go down until the next sideways phase.
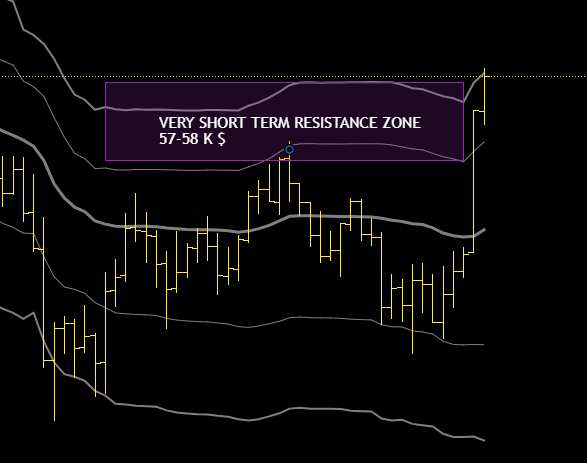
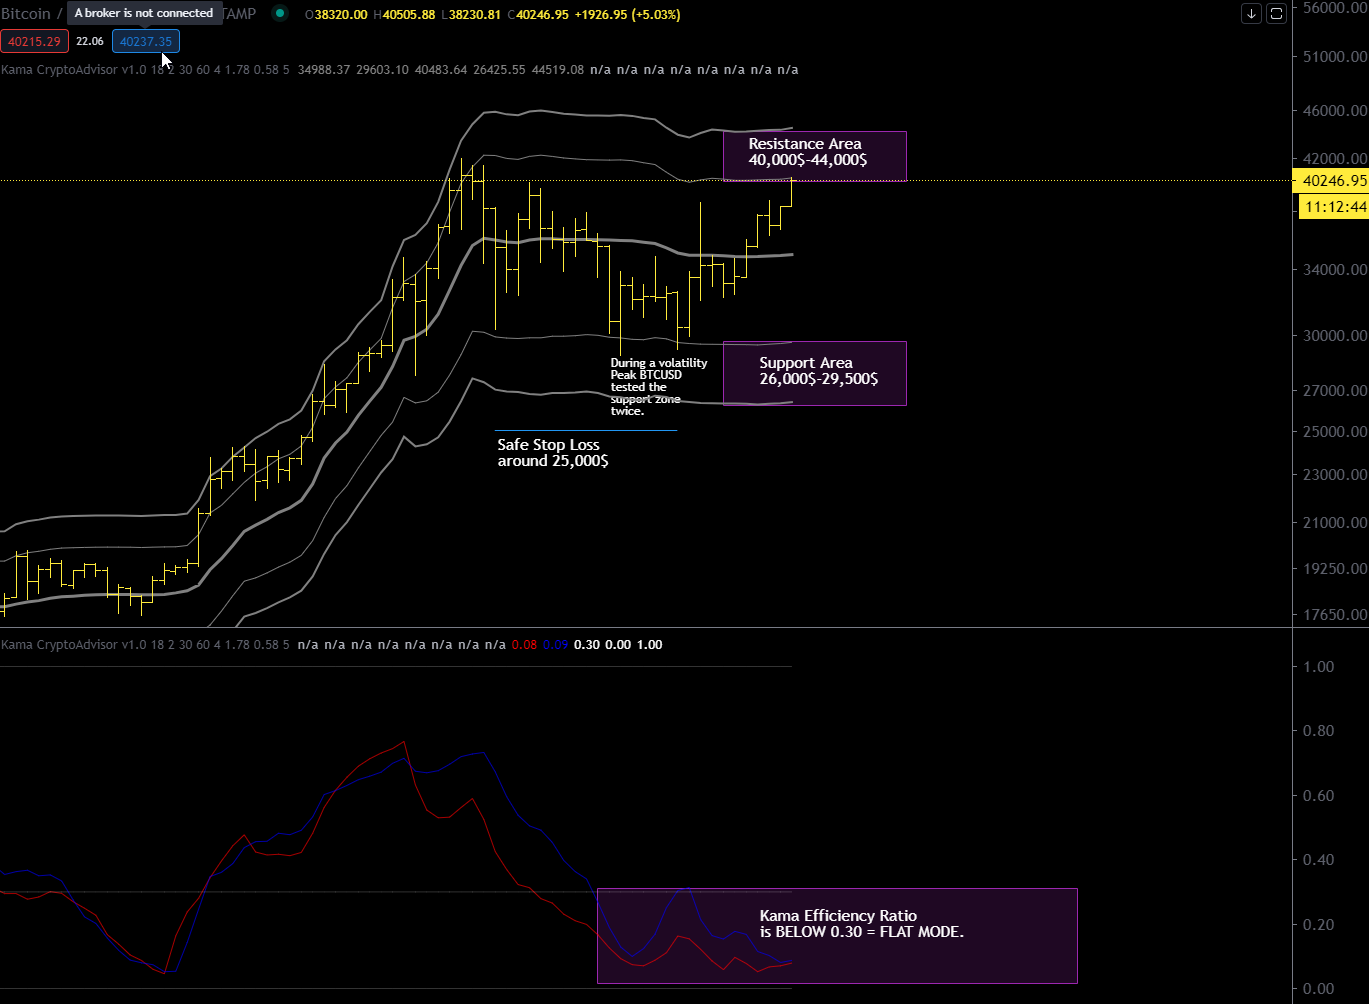
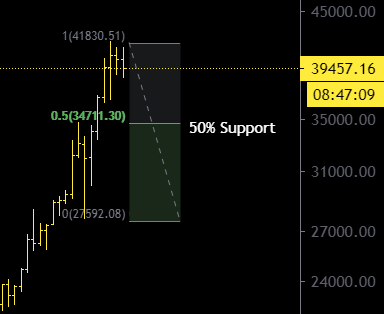
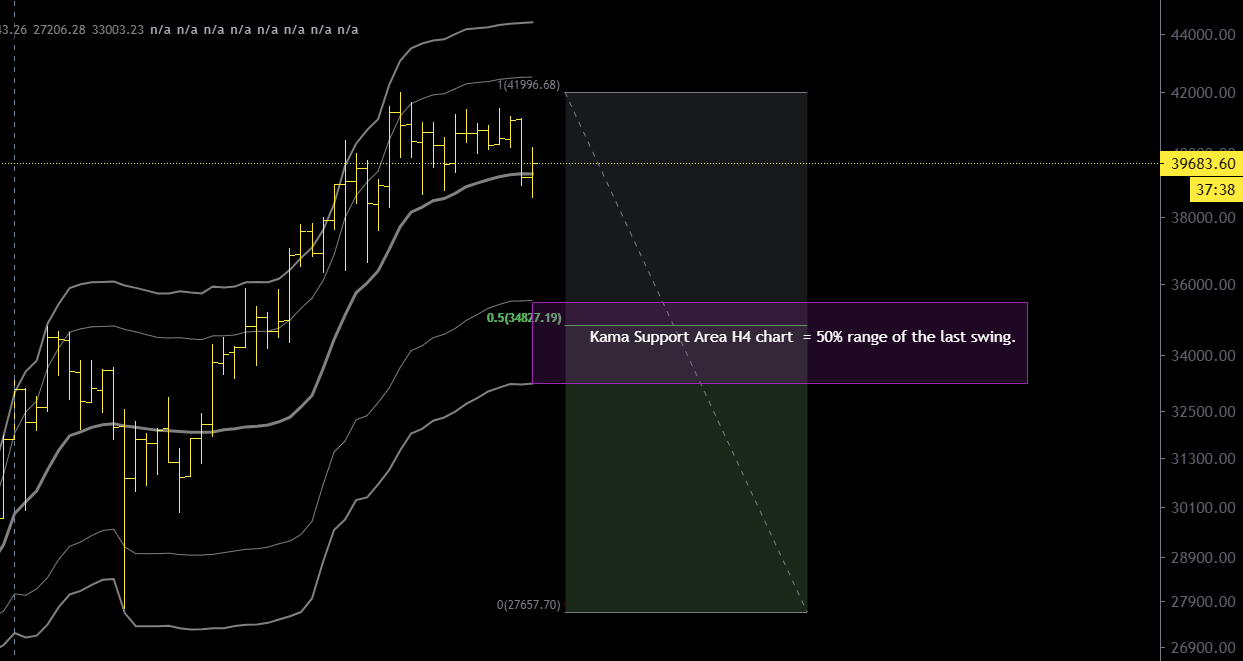
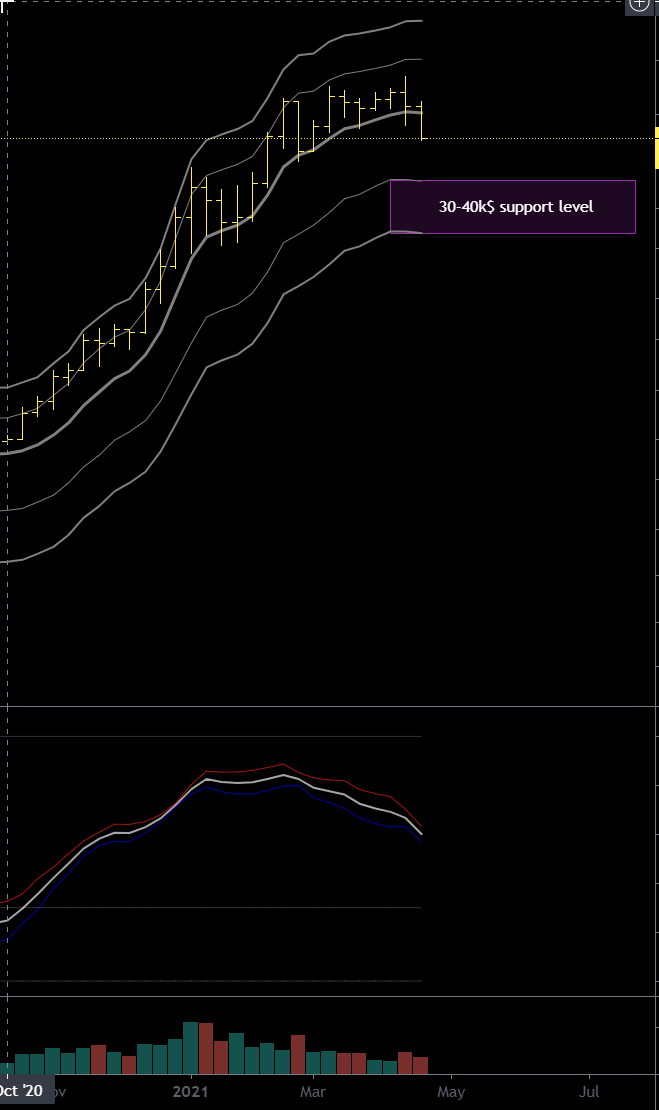
This sideways phase should take place between 30K and 40K usd as shown in the chart below but my bet is that 40k usd support will work.
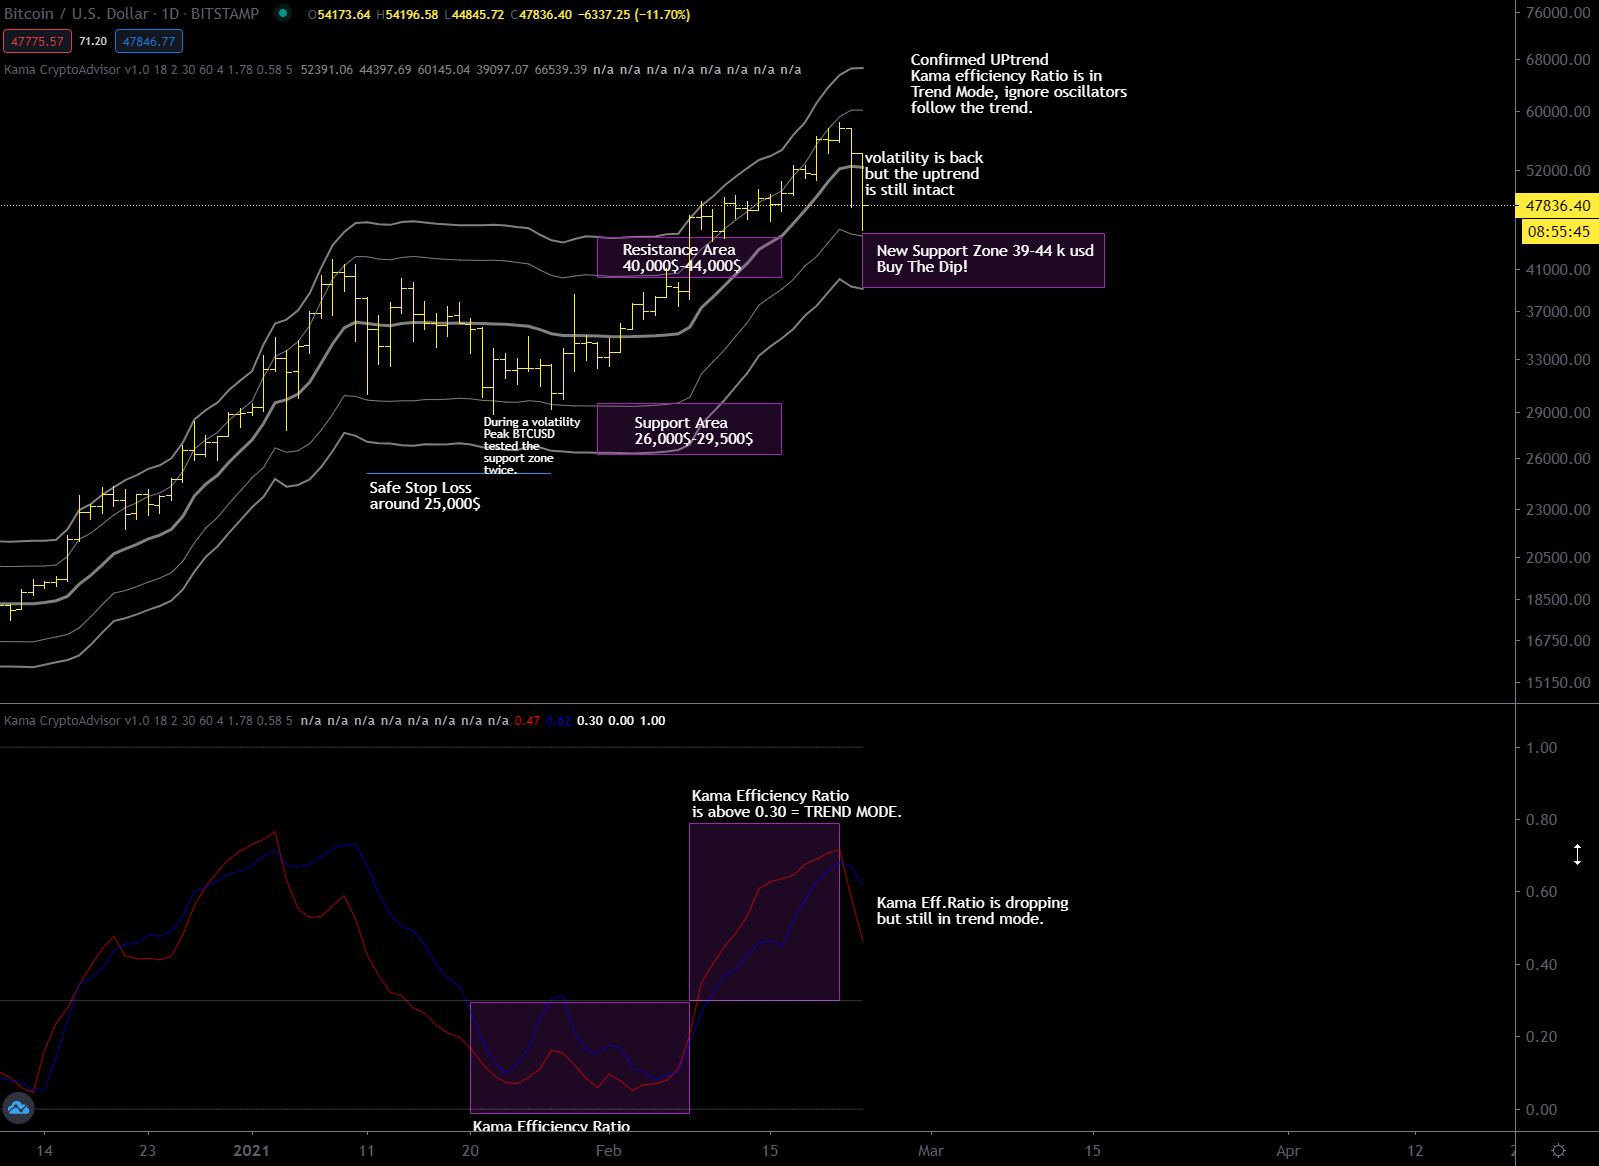
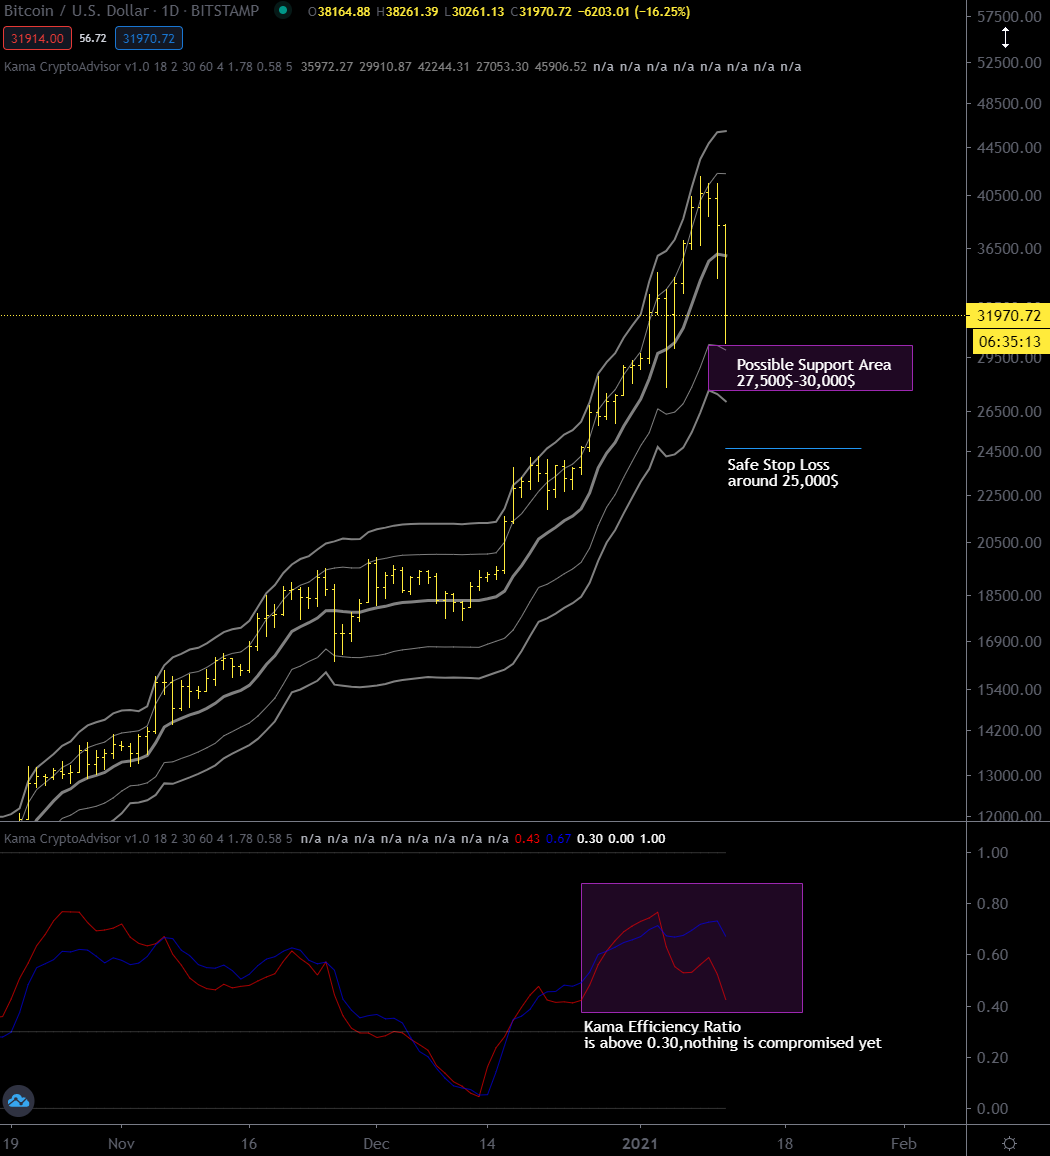
As I told you, the kama efficiency ratio is going down but it’s going to take weeks to get below the 0.30 threshold,so it will presumably take a while before bitcoin will resume the uptrend.
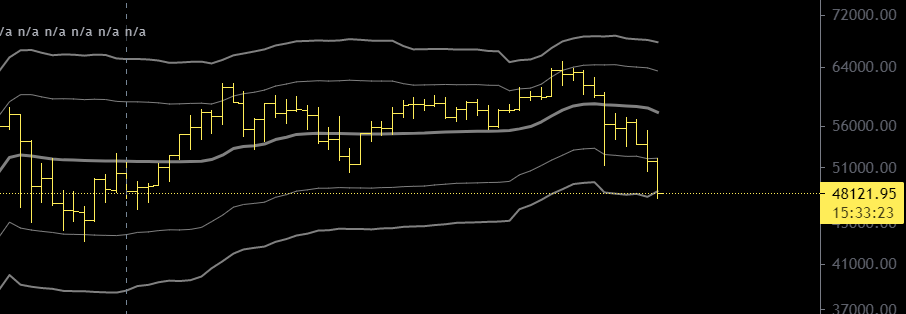
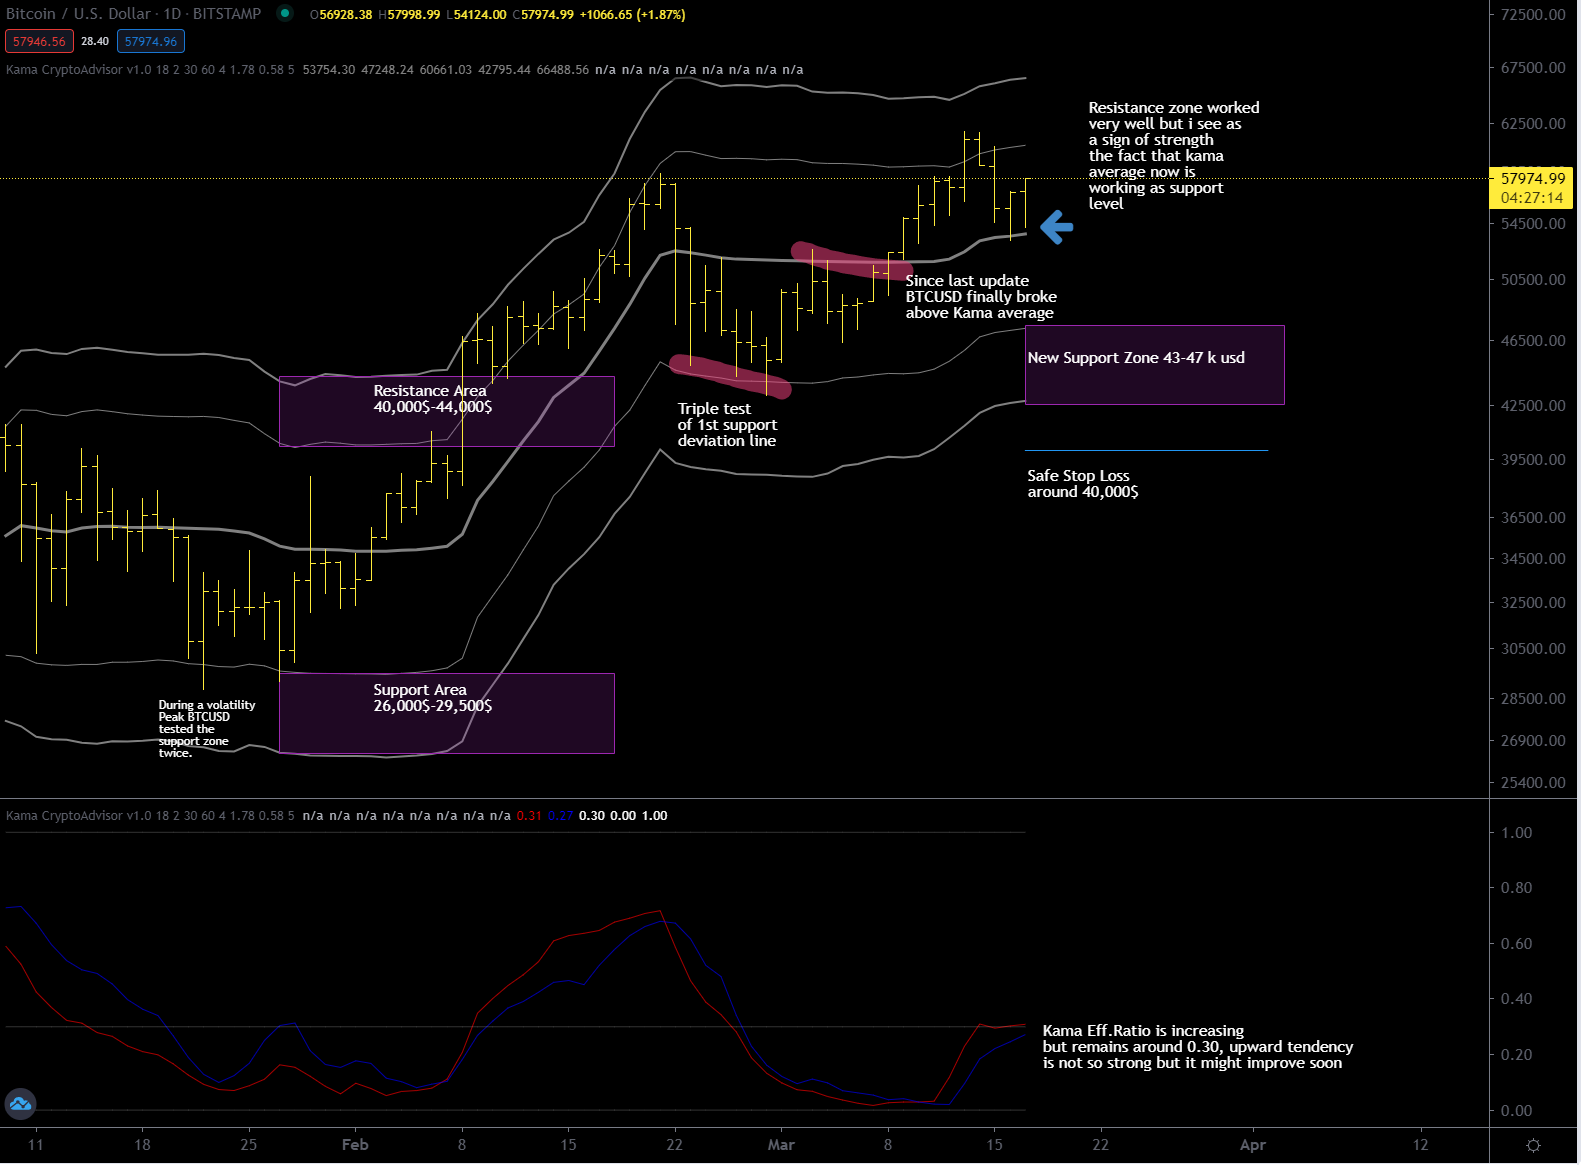
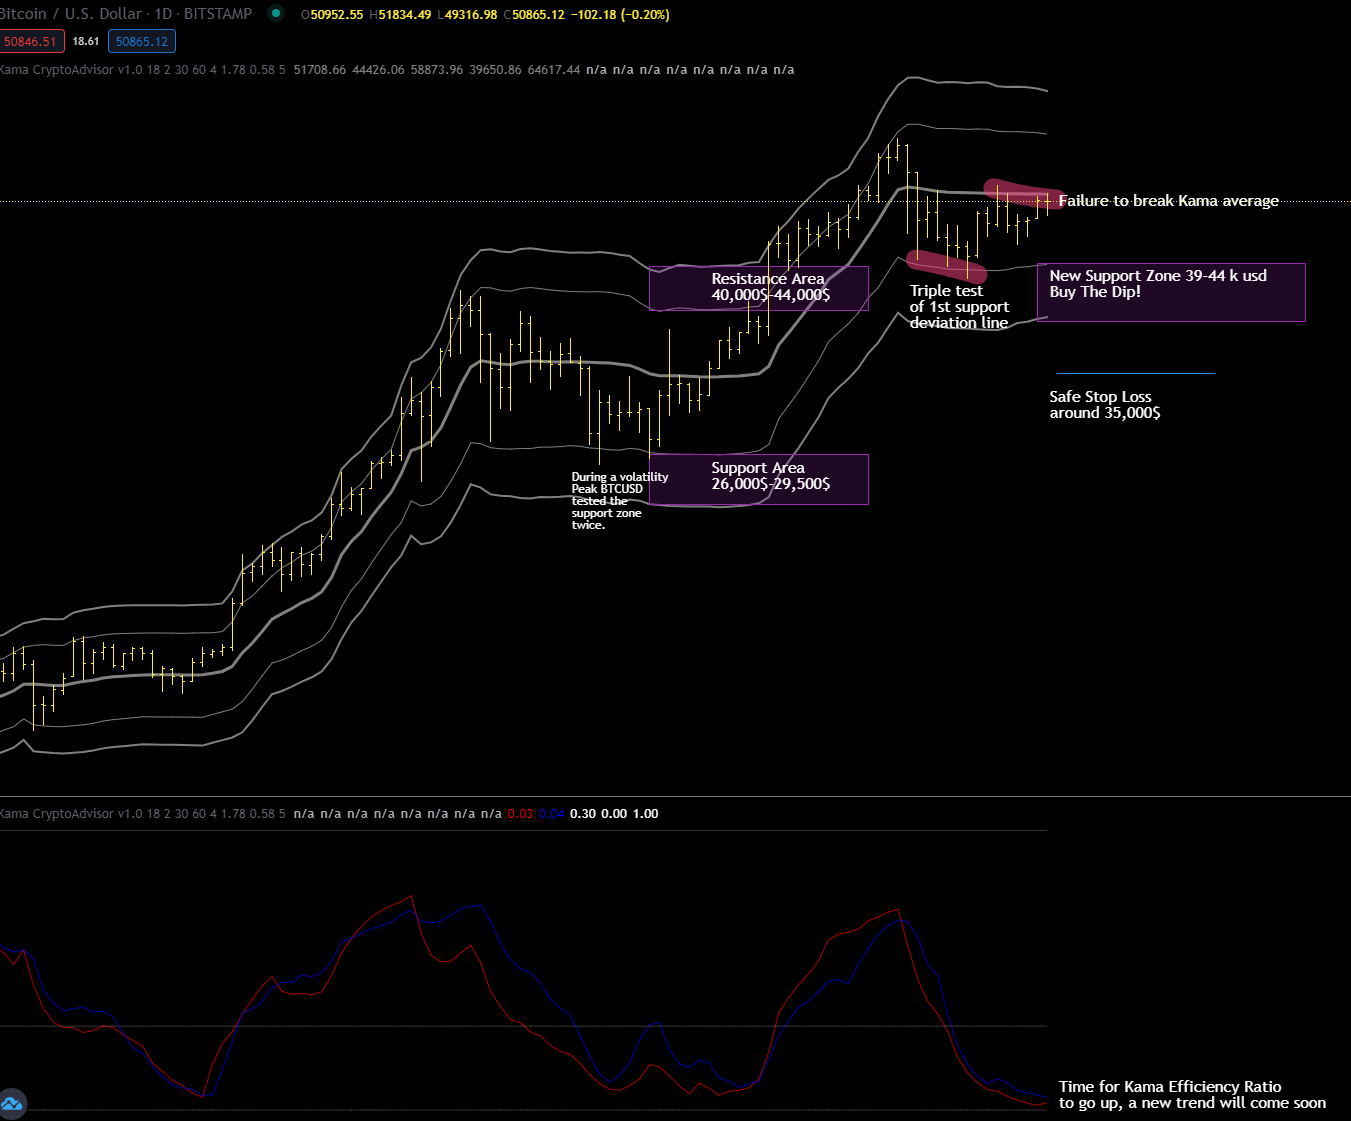
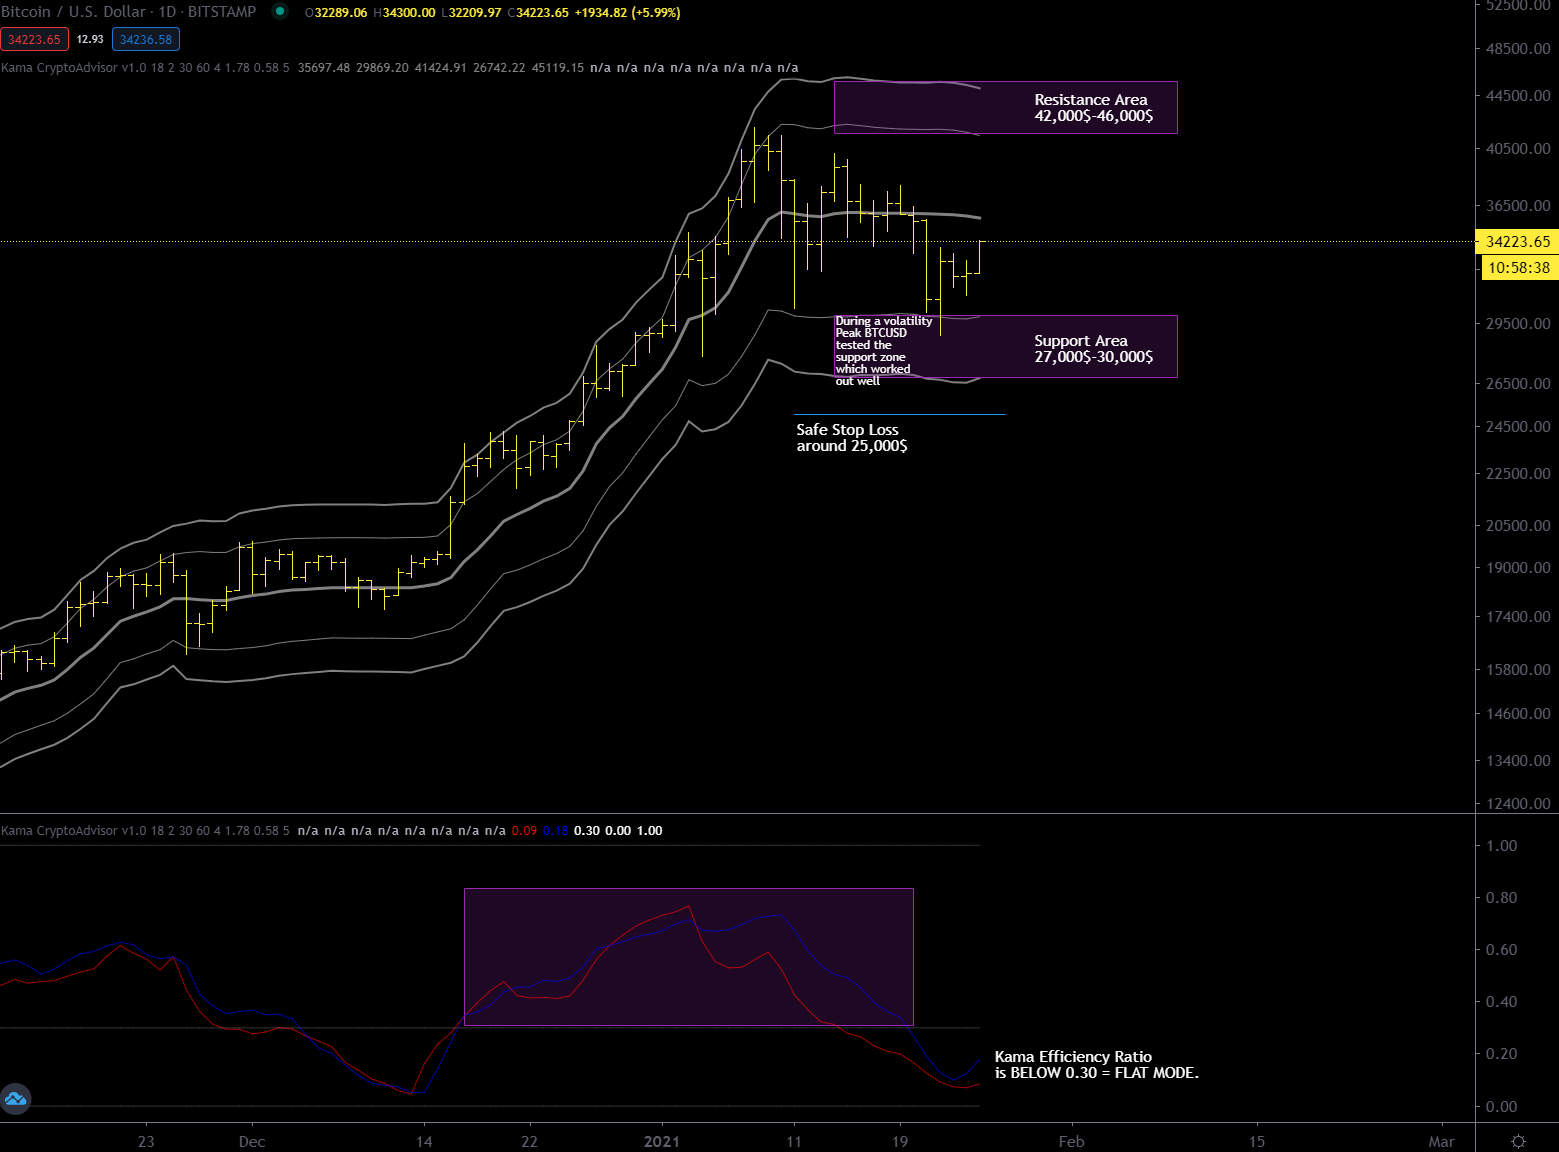
I conclude by commenting on the daily chart where there is strong support but again it is a question of which timeframe will prevail and at the moment I would bet on the weekly chart, nonetheless there might be a minor rebounce from here.