Short Term Update: again at critical key point

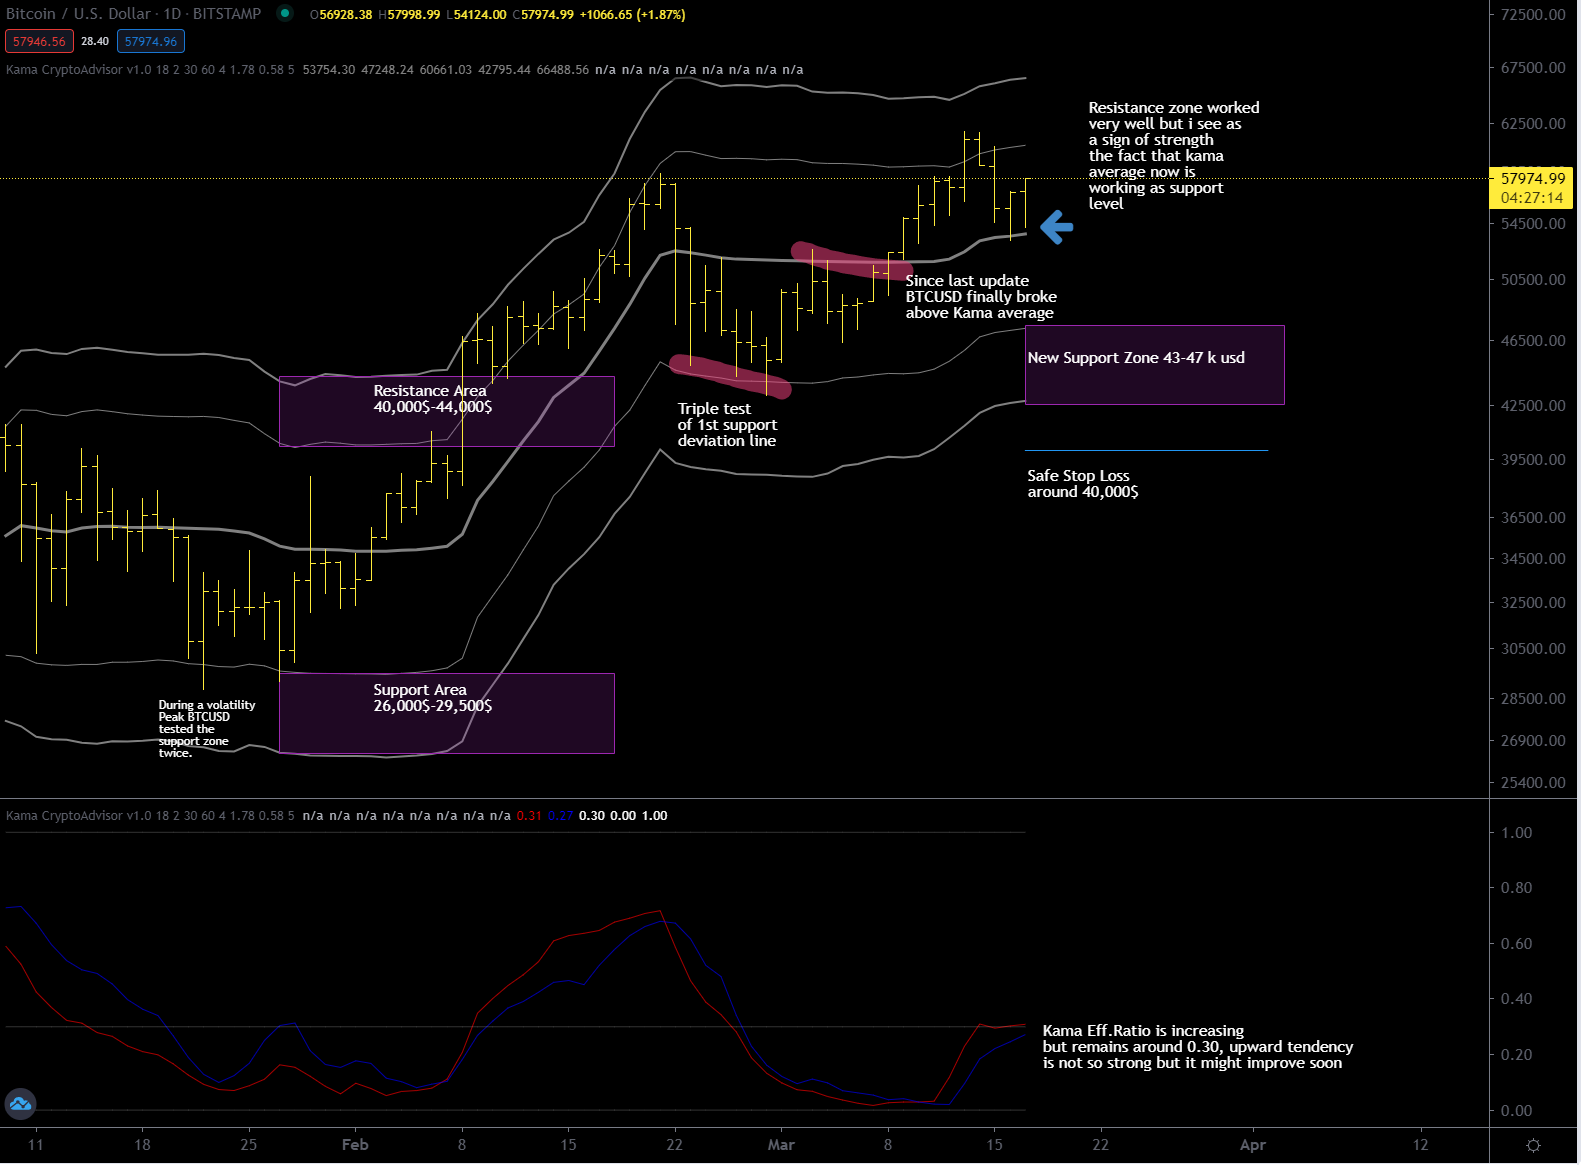
I concluded the previous update saying that it would be critical to see whether or not bitcoin would break through the monthly Kama moving average (51.000$ at that time).
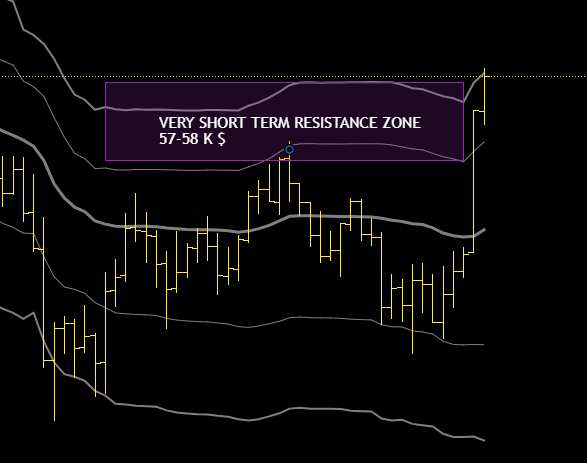
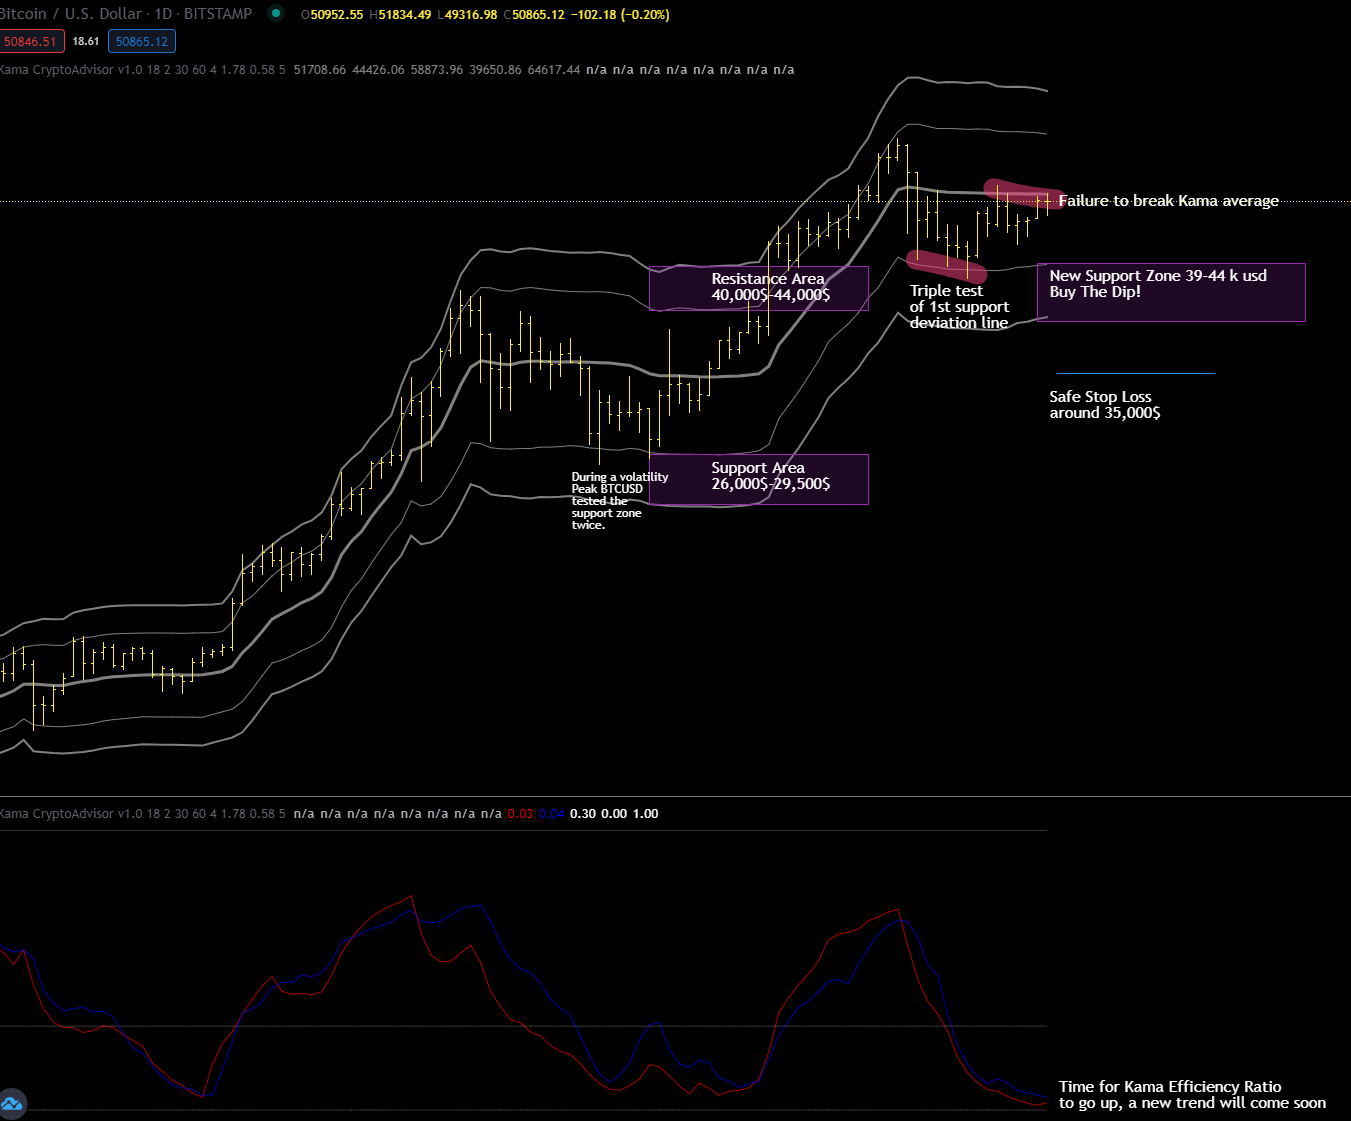
I waited a bit to see the extent of the positive reaction from the value this weekly average had that day, again 51k usd. Exactly like in the previous update bitcoin is again, but this time on the daily chart, on a key point. The price level around 59-60 thousand usd were bitcoin failed to exceed between March 18 and 20 is this new key point and a failure to go above it would probably lead to higher risk to see this thing going below my weekly average.
Let’s be clear, we need to start seeing on the daily chart a sequence of rising highs and lows otherwise there is always an increasing risk that the bearish scenario hypothesized in the previous update comes true.
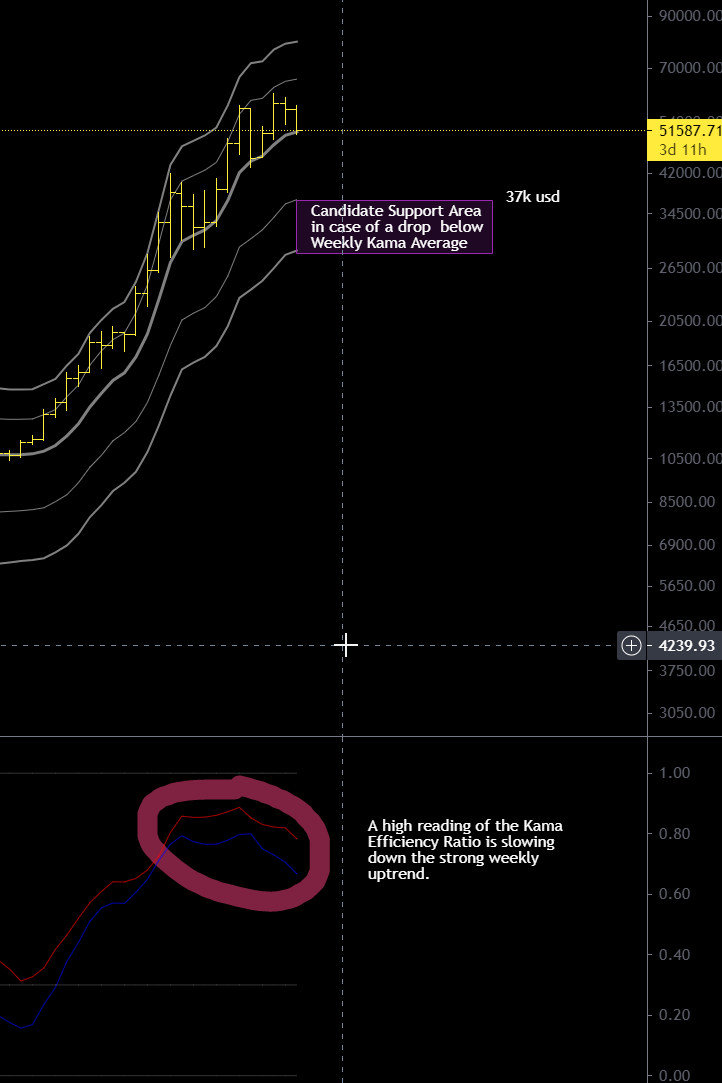
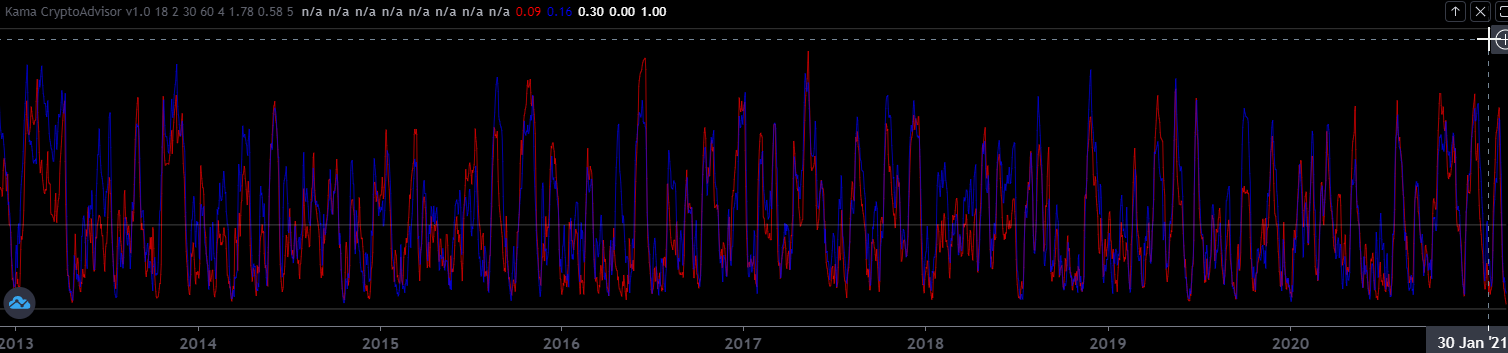
About this weekly average I note that since this strong trend started bitcoin has never spent too much time below it as you can see in the below chart.

BTCUSD Weekly Chart – Kama Average and Price Bands

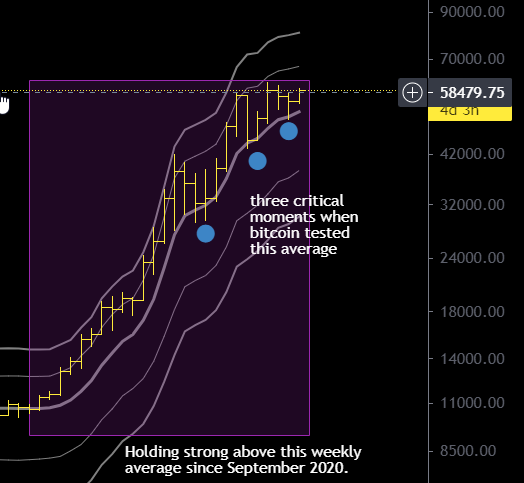
What will happen? Bitcoin is probably going to continue to go up at a lower rate because as I’ve said many times since January the weekly kama efficiency ratio has to go down and it’s going down. Today we are at 0.70 from a high of 0.85 that bitcoin reached on the first Top of January and on the second one of February, I remind everyone that this value represents the ratio between volatility and directionality and varies from zero to one. You can see by yourself that after February we are going up with less intensity.

The strategy about my ongoing long term trade does not change, I continue to leave the trailing profit at $29,000.
It will be interesting for me to see if in the next few days bitcoin can make a new high above $60k.

Take care and see you at the next update.

Why this Drop?

I was saying in the last update that a bottom on the Kama average (daily chart) is a high and strong bottom, which suggests new highs coming.
This is not happened and usually, I emphasize usually, if after a relatively high bottom we do not have a new top what happens is that it may develop a sustained decline and is exactly what has happened in recent days.

This behaviour in my opinion can be explained by the situation on the weekly chart that i already pointed out in the long term update of last January 19, 2021.

In the chart below you can see that once arrived around 0.85 the kama efficiency ratio has begun to decline slightly, the consequence on the graph is a slowdown of the weekly trend in progress.
I do not think that the consolidation phase of the Kama ER (eff.ratio) is over, therefore the risk is that the lower part of the bullish channel might be tested, with the first support at 37 thousand dollars and the next at around 29 thousand dollars.
This risk of a drop exists and could materialize in the coming weeks, therefore the operating strategy requires a change, the stop loss that I once suggested at $35,000 could be too close and should be moved below $29,000 to remain protected from the volatility of this market. You don’t want to get caught by the market at the bottom and then see the train leave without you on board:)
Stay alert and lucid because a good buying opportunity could be coming, between $29K and $37K. It’s crucial to see if these days BTCUSD will stay or not above weekly kama at 51,000$

BTCUSD Weekly Chart

Short Term Update: Bullish development

Since the last update bitcoin was flat and below the daily Kama average, it managed to break to the upside and what happened in the last 10 days is a positive development.
We don’t have a confirmed upward trend yet but we are almost there, the efficiency rate of the Kama average is at 0.30 on the limit value that separates the “flat mode” from the “trend mode”.

BTCUSD Daily Chart

I don’t think we’re going down to the support zone between $43k and $47k, I think we’re going to go into the new resistance zone with a resistance level around $67k.
For those who want to follow the trend can use the hourly chart as reference for entries, right now the bitcoin is trying to force the resistance at $58000.

BTCUSD Hourly Chart

I usually don’t use the hourly chart with this indicator, it would be necessary to look for settings that are good for intraday charts but this time it looks good, that resistance zone is working and a breakout would imply a confirmation of the daily bullish trend.

Short Termp Update: Again Flat, “Ad infinitum”

Because of cyclicality of the things that surround us also the markets oscillate endlessly between phases of congestion and trend, between moments in which the volatility/trend ratio is almost zero to others in which it is maximum.
By dint of following my updates I hope you will succeeded in understanding this fundamental concept, then you will begin to look at the markets for what they are, balloons that continuously inflate and deflate or alternatively, if you don’t like the metaphor, a breathing lung.

Kama Efficiecny Ratio – 8 Years of BTCUSD Breath

The image above represent the last 8 years of the bitcoin/dollar kama efficiency ratio. As you can see for yourself, when the market peaks immediately the volatility trend ratio drops because the market takes a break, exhaling the previously inspired air.
With BTCUSD there is a strong 60-day cycle in the Kama Efficiency Ratio indicator, it means that , on average, 60 days separate two peaks in this indicator, it does not necessarily mean that there are 60 days between two highs or between two lows, due to the nature of this indicator it can happen that there are 60 days between a low and a high or between two lows or between two highs. I hope to be clear on this concept to avoid confusion but a peak in the Kama Efficiency Ratio does not necessarily mean that there is a top, it can also be a market low.

Can we use this information to try to predict the next spike on the kama efficiency ratio? We can but we must evaluate the results with caution.
The last peak happened on February 21, so the next peak could be around April 20, where we will have either a Top or a Bottom.
For now, as you can see in the chart below, the Kama efficiency Ratio is very low, in fact BTCUSD is flat and between the Kama average and the first line of support, tested 3 times in recent days.

If you got the metaphor, now is the time for the “bitcoin animal” to start with a new “inhale, exhale” cycle, the volatility/trend ratio (Kama E.R.) is very lows soon we will have a new established trend on the daily chart.
In case of a downtrend the next bottom could be inside the support zone, between 39 and 44 thousands dollars; if an uptrend will develop the next target could be towards the resistance area near 65 thousands dollars.

Ok guys, I leave you saying that I moved my stop loss to 35000 dollars, it now has become a stop order to protect the profits achieved so far. See you at the next update.