Long Term Update: daily view @bitstamp

chart
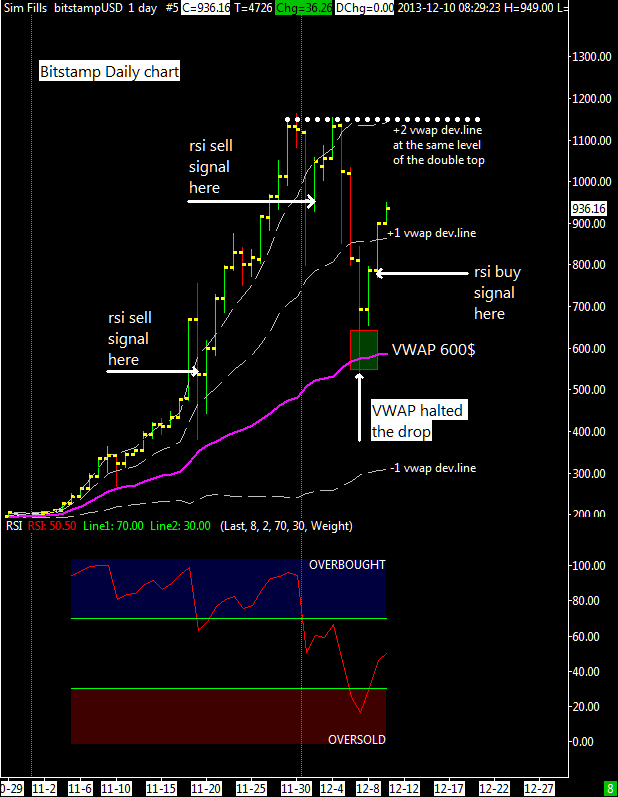
This is the chart of the last 50 days , since the first days of November when the big rally started . We see immediately that the average VWAP acted as important support during the fast fall from $1,160 . The same oscillator i use for the short term updates can be applied on a daily time frime, i have shown in the graph two short signals , the first of which did not work because when the RSI is saturated it  will always signal the opening of a short positions at the first weak bar of an uptrend . You should always try to have a general picture of the situation, if the average VWAP is in an uptrend is always dangerous to follow the bearish signals from an oscillator such as RSI, you have to wait an indication of weakness in the market observing also the volume activity. After  the second sell signal shown in the graph the market has made a double top and then began to descend showing weakness and confirming the sell signal; that could be the time to open short positions , it was December 6 , and the price was about $ 850 . At that time I hesitated to sell and i closed my short-term trade shortly after  at $ 724, after which i have been criticized by many of you. It is true , i could have sold before at a higher price or not sell at all but i have had a good profit and it’s ok; i’m still in for the long term, and as an early adopter (i’m here since late 2010) i’m holding a decent quantity of bitcoins.

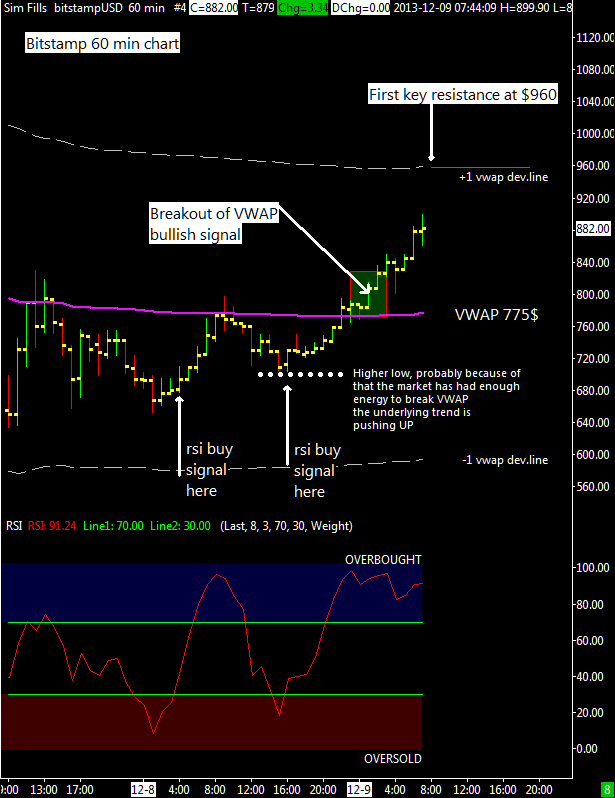
Price is holding above the midpoint ($ 650) of the last rally and it is moving upward towards the 2nd deviation line of the VWAP, located at the same level of the recent double top. There will be probably a correction before moving above the all time high at $1163, that correction could be a nice buying opportunity for who is looking for a good moment to buy.

The target for the next top could be around 1400$, third deviation line of current VWAP.

Short Term Update: Bullish again @bitstamp

chartThis night BTC/USD has managed to break above the VWAP, probably because having made a higher minimum at $700 it was already unbalanced to the upside and had enough energy to break the resistance, with now prices trading above the VWAP bitcoin is bullish again, at least in the short term.

The first key resistance is positioned at the first deviation line at 960 dollars. The RSI is overbought and may stay there for long if the market maintains a defined trend, now to get a clearer picture you have to spend time analyzing a 4 hours chart, or even daily. We’ll see it when i’ll publish a long-term update.

Short Term Update

chartThis night i’ve lost a clean buying opportunity at around 5 am (gmt+1 time) , unfortunately as a human being sometimes  i’ve to sleep.
Once rsi cross the thresold you can evalute if to take the trade or not by looking  VWAP lines as an estimation of price position.
Considering the high level of volatility the distance between the lines increased so in these cases you can consider an intermediate level between  VWAP and first deviation line  (not plotted on the attached chart but it is around $670) . So having good price and time indications it was wise to take the trade at around 680$ and it’s preferable to maximize the trade outcome closing it when a resistance is met (the vwap) and when rsi is overbought. Both conditions happened later and this trading opportunity has been a very clean one; very often these market movements are very smooth and natural.

Now BTC/USD is sliding with a reduced speed and it might do an higher low, probably above 650$. RSI indicates an oversold position and my gut feel tells me that a bottom is near the corner, probably 3-4 hours from now.

Eventually you can add bollinger bands and look for a bollinger band squeeze, it occurs when volatility falls to low levels and the bollinger bands narrow. Periods of low volatility are followed by periods of high volatility. Therefore, this behaviour can foreshadow a significant advance or decline. For example a new advance starts with a squeeze and subsequent break above the upper band. Instead a decline starts with a squeeze and break below the lower band.
The bollinger band squeeze indicator is available with Sierrachart, also with the free version. Have fun experimenting it!

Short Term Update: H1 chart @bitstamp

chartSellers are taking control of this market after the strong sell-off of this early morning (GMT time), at Bitstamp the market found a bottom at 542$, way below my support at around 700$. Since yesterday breakout of 950$ the market has been always below my short term VWAP, a sign that it is more bearish then bullish with every rebounce ending below VWAP as indicated on the attached chart on the left.

I’m planning to close this short term trade, at the moment i’ve a sell limit order at around $775 . For investors who prefer to hold the position open, it is important to close this week above 700$ and it is necessary next week to see a good reaction (with decent buying activity in terms of volume) to at least $900-$950.

The 50% retracement of this rally upswing (from $140 to $1160) is around 650$ and it is important because what the market do at the halfway level of a major rise or decline is crucial. The greater the move, the more important the 50% principle.
According to this Principle, if the BTC/USD , after all its fluctuations, can settle and hold above the halfway level, there’s a good chance that this end of the drop will rise, allowing the BTC/USD to test its prior high. But if the BTC/USD can’t settle above $650, then the odds are that it will sink further, taking it down to test or even break below its today 542$ low. In this event a bear market might start with a long term bottom around the $250-$300 price zone. As i said, next week will be important to see where this market will settle and hold.
Aniway, despite these considerations, and because at the moment i’m a bit uncertain of what will happen, i’m going to close my trade soon.

Short Term Update: Hourly chart at Bistamp

chartThe chart you see left this post tell us that the short term tendency is still up, price is still above VWAP with positive netvolume so this is a bullish configuration and as long as it continues the sensible expectation is for higher prices.

I have shown in the graph another trade opportunity using both vwap indications and RSI oscillator (i use 8 for rsi period instead of the common used value of 14). When RSI enters overbought or oversold territory is always safe to close the trade if there is a decent profit on the table, don’t be greedy:)

Price range for today is $928 – $1080 at bitstamp.


Quick Short Term Update: 15 min Chart Bitstamp

chartStrong drop this morning after the China ban on Bitcoin, the market found support with a triple bottom at 840$ then reacted up to the first deviation line of today VWAP, the relative strength index oscillator worked very well giving a nice timing indication for entering and exiting a short term trade.

As long as price stays above today VWAP at 960$ i’m not much concerned for the bearish news impact on bitcoin, instead a drop under today low at 850$ should lead to an important test of my long term support at 700$ (weekly moving average).

Short Term Update: hourly chart at BTCchina

chart

Hourly chart at BTCchina, it is interesting to see that the market behaviour has been bearish all the way down since 1240$ top of yesterday. The volume activity also confirms the short term weakness, bearish volume (second pane in the attached chart). In the third pane there is the total volume, two volume spikes are visible when the market bottomed twice at 950$.

I think that now there could be a short term trade opportunity, for who want to try i recommend to buy now and sell half position at the first resistance , the VWAP at 1055$, and the rest of the position at the first deviation line, around 1150$. Stoploss  should be placed below the double bottom, at around 920$. Also the relative strength index oscillator confirm the trade because it is reversing to the upside from an oversold position.

UPDATE 10 HRS LATER
chart
As you can see the signal worked and now we are at a resistance, the VWAP, and the RSI oscillator is overbought, both price and time indications that advise us to close the position in profit. This is a nice example of the intraday possibility of this market.

Long Term Update: Weekly Chart at BTCchina

chartI enclose here on the left the weekly chart of the BTCchina exchange of the last 6 months, converted from CNY to USD for your convenience. On this chart i have highlighted how the break of resistance at $ 135 has been followed by a strong rally all the way up to 1240$. Analyzing the net volumes we can see that this week is the first with negative volume activity and could be an early sign of the weakening of the trend in progress.
I think that the ALMA moving average should provide some support around $ 680, also with the formulas i use to calculate weekly and monthly price range i have the same value, around $700 as support for December.
I think that bitcoin will remain in a bullish stance as long as it stays above $ 700, if i see a further drop under 700$ with an increasing negative net volume activity then i’ll probably close my position opened in late August at 140$.

I know that there are out there scared or nervous investors because of the recent insane rally but i think that bitcoin is something new and it can’t be compared too much with other conventional assets (gold, stocks, bonds..) so because of a 1000% move from 120$ to 1200$ it doesn’t mean that it’s all over yet. I’m not scared to hold my long position if i consider the true potential of this new tech sector: cryptocurrencies.

We are at 1k usd but it’s not even yet started with institutional investors still at the window observing bitcoin, i can say this for sure because i’ve contacts in Schroeder, a global asset manager company, and they are monitoring Bitcoin very carefully.