Short Term Update: 4hrs chart @bitstamp

chart
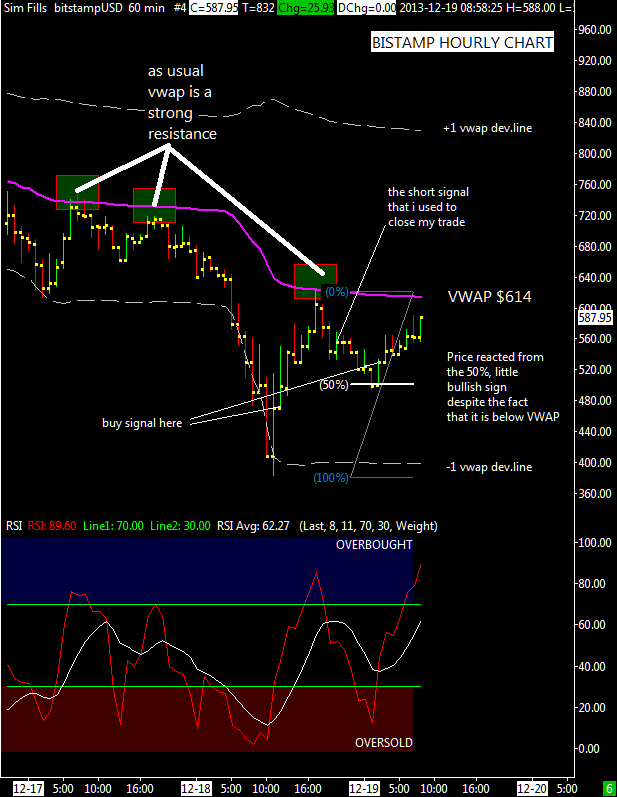
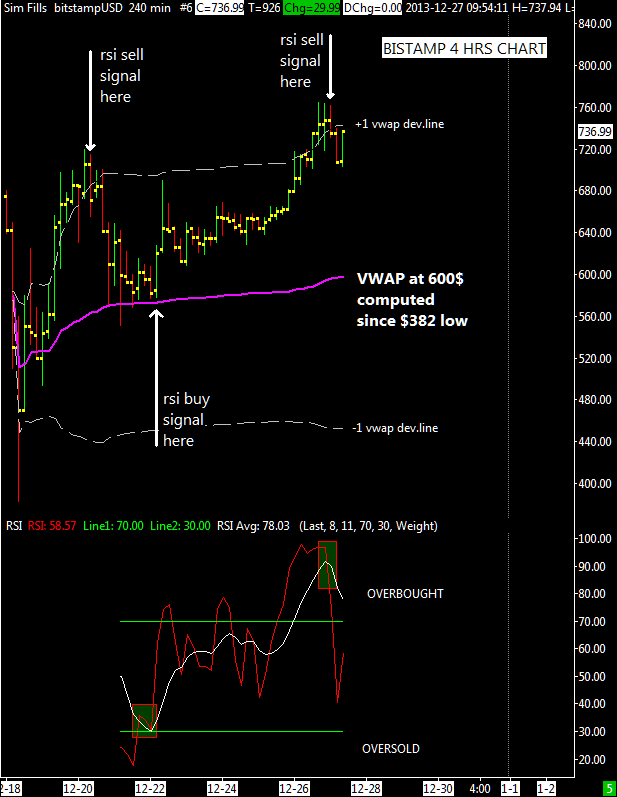
This is the chart from the $382 low of December 18, 2013; the VWAP is calculated starting from that bottom. It’s interesting to see how the RSI buy signal of December 22  is to be interpreted as a nice buy signal because the price was above the VWAP and it was forming an higher low.
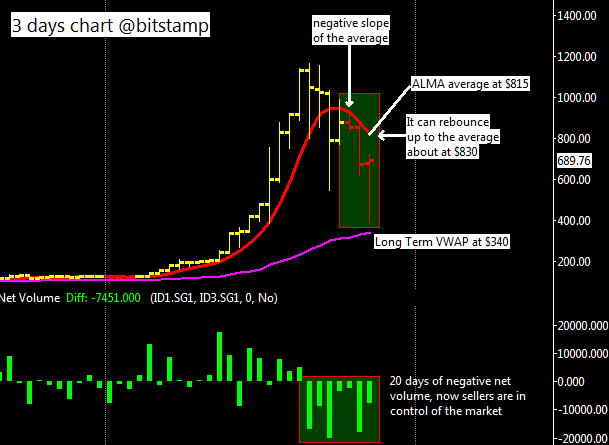
The bearish signal of yesterday from $734 came after an higher high at $765 compared to the previous High at $720, i can conclude that the short term the trend is up but not so strong because of weak buying volume activity.

However i’m not much convinced to open long positions right now because I don’t see a strong positive rate for the volume activity, the net volume improved a bit and it’s almost neutral, a sign that now there is more balance between buyers and sellers, but we are certainly not at the levels seen during the strong uptrend of last November. I’m not saying that it’s forbidden to trade in the short term but you have to be extra cautious opening long positions when the volume is not supporting too much the rise.


Quick Update

What we are seeing is a contraction of volatility or daily range. In general, price expansion tends to follow periods of price contraction, like a cycle. This market like any other market alternates between periods of rest or consolidation and periods of movement. Volatility is actually more cyclical than price.

When bitcoin consolidates, buyers and sellers reach an equilibrium price level  and the trading range tends to narrow like it is happening these days; we need new information to enters the market to move it away from this equilibrium point and finding a new price area.

I think we need to wait January to see some decent fresh news capable to increase again volatility and move the price away from here, either up or down. Net Volume remains weak and there is a lack of strong buyers at the moment. For this week support is the recent $550 low, that is also the midpoint (50%) of the strong upswing from $382 to $720, resistance is around last top ($720).

I want to wish you guys a Merry Christmas and see you soon at the next update.


Long Term Update: 3 days chart @bitstamp

chartI attached here on the left a chart where each bar represents three days, it is something new and a good compromise between a weekly chart and a daily chart, enough to filter out noise but not too slow like the weekly chart.
For those who follow my blog since a while know that i use this type of media, the ALMA , a good tool to use in long term charts.
This average is now pointing down confirming the corrective phase but we are still in a bull market because the price during last months has been above  the long term vwap, now at $340 and also above the 200 days moving average now at ~$250 and rising.

Looking volume activity the net volume has been negative since the first days of December, at some point it was improving but the second bad news from China about the ban on payment processors killed that attempt of recovery from the first low at $542.
To conclude XBT/USD remains in a corrective phase inside a long term bull market, the rebounce might extend up to $815 where there is the ALMA moving average to act as resistance level.

Short Term Update: hourly chart @bitstamp

chartYesterday I sold because the price hans’t be able to get through the  VWAP resistance at $630, then it started to fall and after a confirmed bearish RSI signal I closed my position.

During the night (for my timezone GMT +1) there was a bullish signal always from the RSI oscillator very interesting confirmed by the fact that the drop from $ 625 has found support on the 50% retracement of the first bullish swing ($ 382 -> $ 625).

Today it’s interesting to see if bitcoin will be able to exceed the volume moving average now placed at $614.

Long Term Update: Capitulation

Definition for Capitulation:

When investors give up any previous gains in stock price by selling equities in an effort to get out of the market and into less risky investments. True capitulation involves extremely high volume and sharp declines. It usually is indicated by panic selling. 

The term is a derived from a military term which refers to surrender and it is exactly what happened here, sharp decline at BTCchina followed by europeans this morning. I am watching carefully the VWAP first negative deviation line located at $380, so far the bottom at Bitstamp has been at $382.

chartRegarding my open trade I refuse to sell in the middle of a panic selling also because the daily RSI is almost at zero, totally oversold. I think there will be a strong reaction once the panic is gone and i need this rebounce to close this trade limiting damage as much as possible.
As usual time will tell.

Long Term Update: daily chart @bitstamp

chartThis is the daily chart since November when the strong rally started . Again the VWAP average acted as important support during the strong drop from the secondary top ($980) of the first rebounce ($542->$980) .  Today BTC/USD reacted a bit from the VWAP after the yesterday low of $612.

I think that now we are at a critical turning point, if the market continues to fall below the VWAP then it is a strong confirmation that a new bear market has probably started, with a final bottom around $250-300 in February or March 2014.

At the moment BTC/USD  is still holding above the midpoint ($ 650) of the last rally and the daily RSI is again oversold, there is also a small RSI bullish divergence with the bottom of last December 7, all elements that let me think of the possibility to see a reaction up to $780-$800 as long as it stays above the support area ($630-$650).

The trade that I opened yesterday at $ 676 is very risky, it could also end up with a substantial loss if the market is going to break decisively the VWAP around $630. If you are averse to taking big risks I advise you to stay out from the market at the moment till it will finally decide which direction to take.

Short Term Update: H1 chart @Bitstamp

chartI’ll be synthetic and almost telegraphic, the reasons that led me to believe in a possible reversal of the market are:
1) An rsi divergence was forming, a bullish divergence occurs when the underlying security makes a lower low and RSI forms a higher low and this happened shortly after (pointed out in the chart with dotted line)
2) Price was close to the important level of $650,  it bottomed out at $651.54 @bitstamp
3) 667$ was the first negative deviation line using the 4 hours chart

Normally i do not publish on this blog trades so dangerous, completely against the trend and with an high level of volatility, because I am aware that many of you who follow me do not have enough experience to be able to operate in such situations without making mistakes but this time i’ve done an exception. Possible target is the short term average at $780 that is providing resistance, once there i’ll decide what to do. Support level remains at $650.

Short Term Update: 4H chart @bitstamp

chartAfter the initial flash crash down to $542 sellers failed to take control of this market that is currently holding just below VWAP computed using last 15 days of data; the bitcoin price reaction from the bottom has been slightly bullish (price is holding above midpoint level of $766 of the range $542-$990 that represent the first upswing from the $542 bottom) and i believe that we can consider the recent bottom an important one, at least in the short term although i’m not sure if there is enough fuel to move above VWAP at $885 and enter bullish territory.

All these considerations are for the immediate short term, for the long term i’m not completely sure about the direction of the next bitcoin move.

Possible weekly range for Bitstamp is $720-$970 and for BTCchina 4400-5900 CNY.

Short Term Update: hourly chart @bitstamp

chartNot much is happening these days, BTC/USD is spending time above $840 and volatility is dropping (not necessarily a bad sign). I have shown in the graph two trading opportunities, one for a short selling (for who trades at bitfinex) and a buy signal. If the price movement is at least $20-$30 it’s possible to have a decent profit, fee included.

It is true that looking a four hours chart the price is declining with a series of lower Highs and Lows, therefore i should conclude that from now on it has to fall more and establish a new lower low under $542, logic conclusion. Well when it is too obvious in speculation there is always a surprise around the corner; it might drop a bit from here but i think that it’ll stay above my important level of $650.

I’ve added a moving average to the fast RSI i use, it helps in filtering out bad trade signals.

Short Term Update: congestion @bitstamp

chartThe situation is congested, I resetted the VWAP  lines using the last two days to have a picture for the very short term. The RSI oscillator is also congested, it not being overbought or oversold.
In these cases, you have to wait for something to happen to understand what the market wants to do. A possible trading strategy may be to buying bitcoins at the break-up of the VWAP at $ 910 with a profit taking around $ 940, a quick trade for a small profit.

This market is stabilizing above the important midpoint level of 650$ and as long as it stays above it i’m willing to believe that it is slowly preparing itself for a further upmove, probably to $1300-$1400.

Short Term Update: BTC/USD turns down from Resistance

chartBitcoin turns down from the expected resistance level of the previous update. This occurs after price action rose dramatically (around $400  in total) in a substantial bullish correction extending back to the Dec 7 low just above $500. Next downside support target resides around the key $810 price region near the volume average, which is an important support/resistance as explained many times. To the upside, in the event of a breakout above first deviation line, the next upside target to watch resides around the price region of the previous double top ($1150).

Again, a combination of price and time indications has given a nice selling opportunity at $960(rsi sell short signal and first deviation line resistance).