Short Term Update: Daily Chart at Bitstamp

chartThe bitcoin price reaction from the double bottom at $380 has been very bullish and i believe that we can consider this bottom an important one, at least in the short term. As i pointed out in the previous update the bottom has been very close to the VWAP, which is proving to be a good tool to follow the market when it is both trendy or sideway in a trading range.
I now think that prices will continue to rise until the resistance shown in the attached graph, near $ 1,000.
Weekly range for Bitstamp is 650$-1000$, for BTCchina 4000-6800 CNY and i think it might reach 8500 CNY as target at the end of this month or during December.

Psychologically the threshold of $ 1,000 is a nice goal to reach, as it was to reach in 2011 for the first time a dollar of value. When i started to follow the Bitcoin its value was 30 cents and  it seemed to me that we had reached an incredible milestone crossing one dollar at that time, it is amazing for me to watch bitcoin going to 1,000 dollars of value.

Short Term Update: monthly view at BTCe

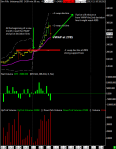
chartThis is the daily chart of this month at BTCe exchange, Bitstamp unfortunately does not work since yesterday.
As you can see our VWAP average stopped once again falling prices, now it is a critical juncture and it is really important not to go under the VWAP otherwise BTC/USD could repeat the bearish pattern seen in April, this means that prices may drop down to 150 dollars where there is also the 200 days moving average.

If this bearish scenario will materialize it would be a tremendous buying opportunity since so far every test to break and go below the 200 days moving average failed.

EDIT
Please readers to don’t ask me how to set sierrachart indicators, i don’t have the time for this kind of support, feel free to post any requests directly on sierrachart support forum at the following url http://www.sierrachart.com/SupportBoard.php or study the documentation at http://www.sierrachart.com/index.php?l=doc/doc_Contents.php#OtherPages 
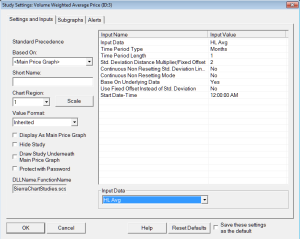
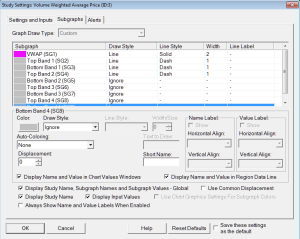
Said this i include here 2 screenshots with the settings i use for monthly vwap (click to enlarge)
vwapdev lines

Short Term Update: How to daytrade on a 15 min chart

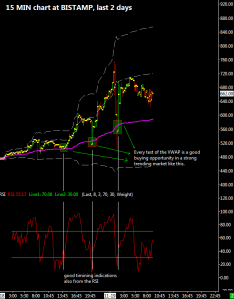
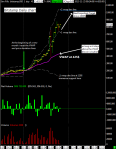
chartFor the first time i reveal one of the techniques that i use for  my intraday operativity on this market. This method consists of using a short term average, the VWAP that you already know but calculated using no more then one or two days on a 15-minute chart; togheter with the VWAP i use an oscillator, the Relative Strength Index or RSI.
Whenever prices are testing the VWAP and an oscillator such as RSI confirms the oversold condition you can place a trade with a stop loss below the first negative deviation of the VWAP, this will leave enough room for your trade to avoid stupid stoploss being taken. You can lock in profits as soon as prices break through the first or second upward deviation.

In the attached example you can see very well how this technique works, especially when there is a strong volatility like these days. The RSI period is 8 instead of the canonical 14 used by most, i prefer a faster setting to have less lag, the thresolds used are 30 and 70, common values for this oscillator. When the RSI is below 30 is oversold and above 70 overbought. To give you an idea if prices at bitstamp retest today VWAP at around 595$-600$ and the RSI is oversold below 30 and then returns above it, i open a long position with a stoploss under 450$ with a take profit at 725$ and/or 870$ (first and second deviation of our VWAP average). If the price is too far away from the VWAP when the RSI cross above the thresold at 30, confirming a long trade, i don’t buy and i simply look forward to the next trading opportunity.
So combining VWAP and RSI you are using both time and price dimensions with the effort to maximize your profits, cut your losses and drawdown as much as possible.

Long Term Update: Next Top at 3600$

bitcoinBull! Bull! Bull! BUY BUY BUY! Yes i know you are reading this all the time on many bitcoin related forums where there is the perma-bull or his alter ego “the perma-bearish guy” crying all the time that we are in a bubble.
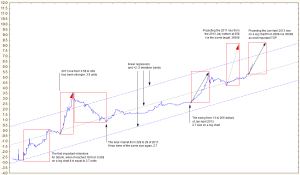
Well, personally i consider a stock or whatever you want in a bubble when it is very far away from a long term regression line. What does it mean “very far away”? When the observation  is outside a statistically significant “prediction interval”. In statistical inference, specifically predictive inference, a prediction interval is an estimate of an interval in which future observations will fall, with a certain probability, given what has already been observed. Prediction intervals are often used in regression analisys like the one i’m presenting here.

I drew a straight line on the graph represents the linear regression of the average prices recorded since August 2010. I added a prediction interval represented by the two lines above and below the linear regression. Bitcoin is in a  price bubble whenever it goes above the upper deviation, on the contrary we can talk about prices significantly lower when we are under the line of the lower deviation, but so far it never happened for bitcoin to be so undervalued.

I’ve noticed that most of the time, important price swing are similar in size if we use a logarithmic scale to measure them, i have shown in the  logarithmic graph the major movements of similar size and i used them to project what could be the next important long term top.

It may be noted that the next top might reach the $3600 price level, just above the current forecast that gives us the second deviation line of the linear regression, a perfect top in a buying climax situation which usually creates the market condition for a rapid fall in the price. At the moment to enter “bubble territory” we need to go above the 1100-1200$ price zone, just above the upper deviation line i’ve plotted on the chart. It is interesting also to note that the April 2013 top at 266$ has been under the upper deviation line while the 2011 top at 32$ has been well above and a true bubble which was followed by a bear market that has brought prices down to $ 2 in November 2011.


Because this market has been stronger then expected i revised my monthly range forecast to:

  • Bitstamp: 450$ – 750$
  • BTC-e: 430$ – 770$
  • BTCchina: 3270 CNY – 5600 CNY

Strong support is always on the VWAP now at 320$-330$ or 2400 CNY.


Short Term Update: daily chart at Bitstamp

chartPrices continue to advance at a good pace, on the left there is a daily chart of Bitstamp exchange. The reaction from the VWAP has been strong and i think there is a possibility to reach a new target at about $ 475 where there is the second deviation of the VWAP that has now shifted upwards from $410 of the previous update up to $475. Even calculating with my method the price target for the end of the month i have about the same level of resistance at 475$ using a conservative volatility factor , instead using the historical volatility of the bitcoin (that is much higher), price target for this month is higher at about $ 525; hardly the prices at Bitstamp will exceed $ 525 this month.

The support zone is always the same and it goes from the VWAP ($ 295) down to the first negative deviation ($ 210), these two levels define the range of prices where i think you will see a very aggressive buying activity in case of a strong drop.


Short Term Update: VWAP test

chartYesterday there was the first serious profit taking by investors of this strong advance in price started in late September. In these cases it is very important that the average VWAP stop the fall of prices and in fact it worked perfectly despite the large volumes that occured at Bitstamp , about 50000 bitcoins .
At this point it is very important to stay above 270 dollars and possibly to react from here up to the second statistical deviation line of the VWAP located at 410 dollars,it would be a good top for November. It takes a lot of strength to go up further and it is very likely that we can drop during the next week down to $ 200, which i consider a very strong support and very important not to violate it.

For now I am waiting for further developments before taking a decision for my open trade , in the case of a break of $ 200 i will be practically forced to close the position to avoid to violate a fundamental rule of trading : do not to allow a profit to turn into a loss; it is very easy to fall in this mistake in a volatile market like this where winning trades can quickly turn into losses.

See you at the next update, and good trading .

Short Term Update: Daily Chart at Bitstamp

chartIt is clearly visible how much strength there is in this uptrend, the VWAP is the main support level and now it’s at 265$ and rising, the price breakout above 200$ has been important confirming the nature of the move as an explosive one, the target for this month is now at 420$ for bitstamp and i computed it as usual using actual volatility that is very close to the insane level seen in June 2011 top, when bitcoin moved from 50 cents to 32 usd in 2 months. I think that there is now enough buying activity to sustain this upmove and it will probably not repeat the crash happened last april, therefore i conclude that my initial target of 340$ will be cleared (it is already happenning right now at BTCchina where converting in usd price is at 416$).

For the bears, if there are any outside there:), the first bearish sign is a drop under 300$ then the penetration of the vwap under 265$ should confirm a reverse in the trend.

Long Term Update: still trending UP

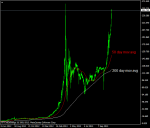
btcusddailyHere is one of the daily bar charts i use to keep track of the current bull market trend. The first thing i notice in this chart is that the BTC/USD is very high and above a rising 200 day moving average (white line) ; a typical bull market configuration. The price is also above its 50 day moving average (red line).

Reactions within a bull market typically take the price below its 50 day moving average and near its 200 day moving average. The July 5 low at 65$ is a good example of a  reaction that terminates at the 200 day moving average and below the 50 day moving average.
The position of the 200 day moving average in this chart give us a reference limit of a correction within an ongoing bull market (now around 120$), so this means that the next important bottom should be at or higher then 120$.

A first possible sign that the bull market is near the end would be a  strong drop below its 200 day moving average followed by a quick rally back to it with a 50 day moving average pointing down. It is not the case here with both averages advancing strongly.

Thinking back to April top at $266 at that time the price was 190 dollars above the 50 days moving average, projecting that situation today we should have a top at about $ 340 ($150 plus $190) which is what i’d like to see: a decisive break of the previous top at $ 266 that will probably attract many sellers.

Instead, a strong move above 350-400 dollars during this month would surprise me confirming the suspect that this market is probably really booming.