
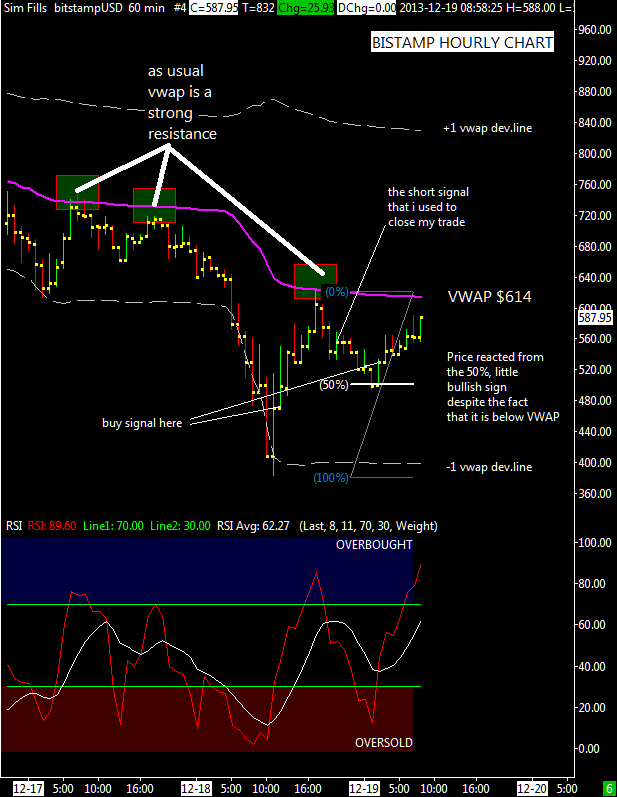
 Yesterday I sold because the price hans’t be able to get through the VWAP resistance at $630, then it started to fall and after a confirmed bearish RSI signal I closed my position.
During the night (for my timezone GMT +1) there was a bullish signal always from the RSI oscillator very interesting confirmed by the fact that the drop from $ 625 has found support on the 50% retracement of the first bullish swing ($ 382 -> $ 625).
Today it’s interesting to see if bitcoin will be able to exceed the volume moving average now placed at $614.
