
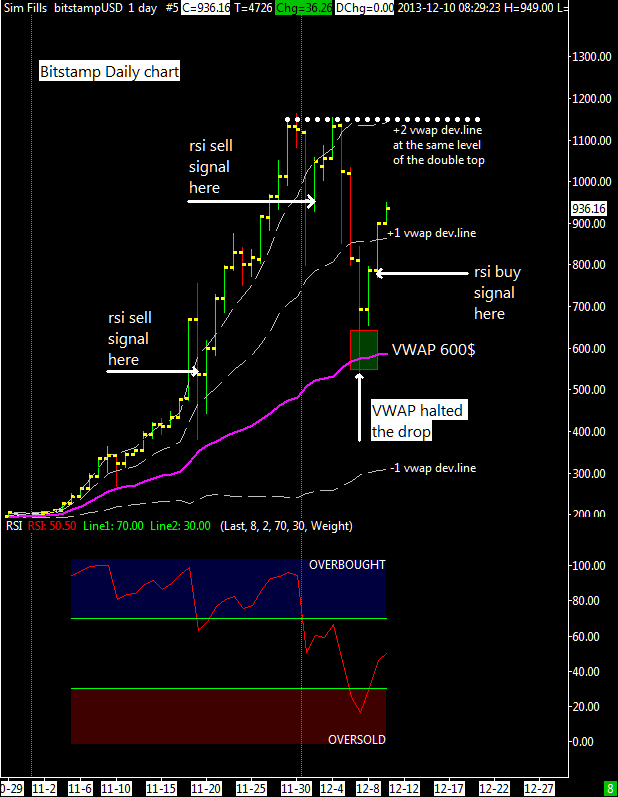
 This is the chart of the last 50 days , since the first days of November when the big rally started . We see immediately that the average VWAP acted as important support during the fast fall from $1,160 . The same oscillator i use for the short term updates can be applied on a daily time frime, i have shown in the graph two short signals , the first of which did not work because when the RSI is saturated it will always signal the opening of a short positions at the first weak bar of an uptrend . You should always try to have a general picture of the situation, if the average VWAP is in an uptrend is always dangerous to follow the bearish signals from an oscillator such as RSI, you have to wait an indication of weakness in the market observing also the volume activity. After the second sell signal shown in the graph the market has made a double top and then began to descend showing weakness and confirming the sell signal; that could be the time to open short positions , it was December 6 , and the price was about $ 850 . At that time I hesitated to sell and i closed my short-term trade shortly after at $ 724, after which i have been criticized by many of you. It is true , i could have sold before at a higher price or not sell at all but i have had a good profit and it’s ok; i’m still in for the long term, and as an early adopter (i’m here since late 2010) i’m holding a decent quantity of bitcoins.
Price is holding above the midpoint ($ 650) of the last rally and it is moving upward towards the 2nd deviation line of the VWAP, located at the same level of the recent double top. There will be probably a correction before moving above the all time high at $1163, that correction could be a nice buying opportunity for who is looking for a good moment to buy.
The target for the next top could be around 1400$, third deviation line of current VWAP.

Hey, long time lurker here.
What is your exit strategy for the long term holdings?
I’m curious about this because at some point a bitcoin stash might become so big (purchasing power) that the marginal utility of having more value is quite small. This might happen before you personally consider bitcoin’s potential to be fully utilized and priced in. What to do? When to stop playing the game? Have you eg. set a dollar value when you cash out like 10 M USD or something like that?
if there is another correction, what range would be your buy back orders enky?
Hello Enky, did you redownload all bstmp historical data? Because the VOLUME was totally messed up, fixed just yesterday. (VWMA is not sideways) https://www.sierrachart.com/SupportBoard.php?ThreadID=4467
http://www.sierrachart.com/image.php?l=1386706825774.png I don’t trust this “recovery” yet.
Thanks you for making this Blog!
I’ve enjoyed your charts. Thank you. What bothers me about the chart is the progressively decreasing volume in the last 3 days of greens. I imagine the sellers have been flushed out and subsequently it takes little relative volume to get it moving up. What is your read on the volume? Thanks.
Hey Enky, I’m new here and to Bitcoin. I live in the USA and I’m interested in trading Bitcoin as it seems like a traders dream with the large percentage moves. My question is what is the best way to trade it? I viewed your recommendation page but I’m having difficulties with sending money to places like China, Russia or the others. If you don’t mind me asking, which do you personally use and how satisfied are you with them? Thanks and I like the information you offer here.