
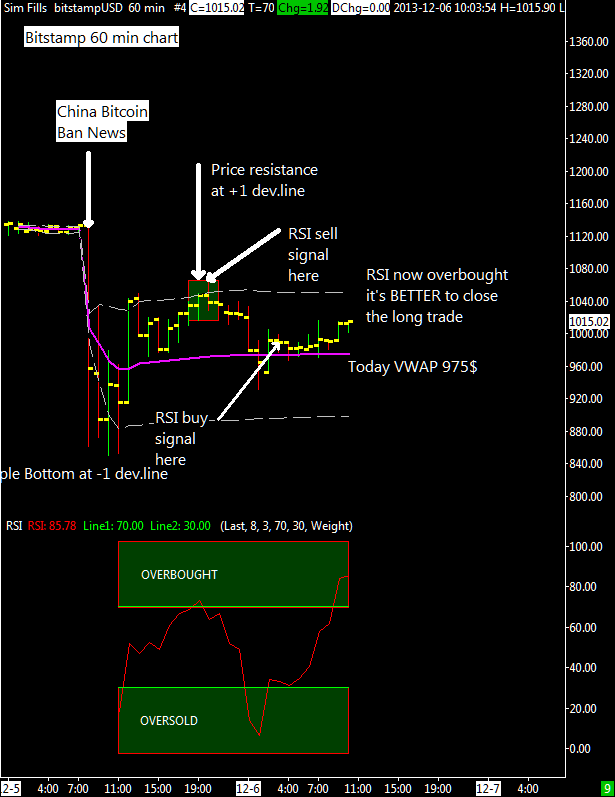
 The chart you see left this post tell us that the short term tendency is still up, price is still above VWAP with positive netvolume so this is a bullish configuration and as long as it continues the sensible expectation is for higher prices.
I have shown in the graph another trade opportunity using both vwap indications and RSI oscillator (i use 8 for rsi period instead of the common used value of 14). When RSI enters overbought or oversold territory is always safe to close the trade if there is a decent profit on the table, don’t be greedy:)
Price range for today is $928 – $1080 at bitstamp.

Bitcoing seems a bit bearish lately. What do you think?
I think Baidu has something to do with this.
http://www.businessinsider.com/bitcoin-falls-below-900-2013-12
Busted through 700
That´s a ride 🙂
Have just the bearish scenario materialized?
What now.. when we even dipped below $600..?
I think what we’ll see is a repetition of what happened at the previous rally back in March. The price will stabilize somewhere between the value at the beginning of this rally($200?), and the top(around $1200). So this could mean around $500-$600. Then, if we can learn from the past, it will stay around this value for 4-6 months, just as it stayed around $100 after the previous rally. Then we might just have to wait for the next rally, which will take us to new highs, possibly around $4000-$5000.
It seems to me that this is just the way that btc rallies work.
Of course, there are many things that could trigger the next rally: adoption from a major player(Google, Amazon, Ebay), the stock market turning bearish, QE-infinity madness, or even just the masses of common people liking the idea of crypto-currencies and starting to buy small amounts of BTC just to make transactions with their own mobile.
Enky, do you agree?
This is a classic bull market and a very sensitive one at that. Very news sensitive with very wild tenancies because there are no traditional conservative investors (ie the type that invest based on calculated annual return expectations). Suggest study of market psychology – there are a million classic books on it, or just buy and go do something productive 🙂
my trial on sierrachart is over, what features can I still use ?
(currently I can just see the graph, it’s not updated anymore..)
so no more real time update?
damn
I can’t find any ‘bitcoincharts plugin” for sierrachart
https://bitcointalk.org/index.php?topic=6019.0
I can’t get it to work..
woops sorry will try your link, I didn’t see your comment.
Can’t get it to work. 😦
I’m not sure I wanna trade without sierrachart.. It write everywhere it’s not connected.
Oh okay mtgoxusd.bcid works for some reason.
How can I make btceusd work?
Yep I did what you wrote just a minute ago. I’m so sad there’s no LTC here.
I (again) didn’t stop loss and bought my ltc at 39.2, I’m getting bored so I’ll try to “minute-trade” but I need fast information. 😦
Are you selling now your long at this bounce because we broke important supports earlier?
I though that was some sauvage ad but his graphs aren’t bad.
I won’t say it’s better than btctrading, it’s another pov.