
 Bull! Bull! Bull! BUY BUY BUY! Yes i know you are reading this all the time on many bitcoin related forums where there is the perma-bull or his alter ego “the perma-bearish guy” crying all the time that we are in a bubble.
Well, personally i consider a stock or whatever you want in a bubble when it is very far away from a long term regression line. What does it mean “very far away”? When the observation is outside a statistically significant “prediction interval”. In statistical inference, specifically predictive inference, a prediction interval is an estimate of an interval in which future observations will fall, with a certain probability, given what has already been observed. Prediction intervals are often used in regression analisys like the one i’m presenting here.
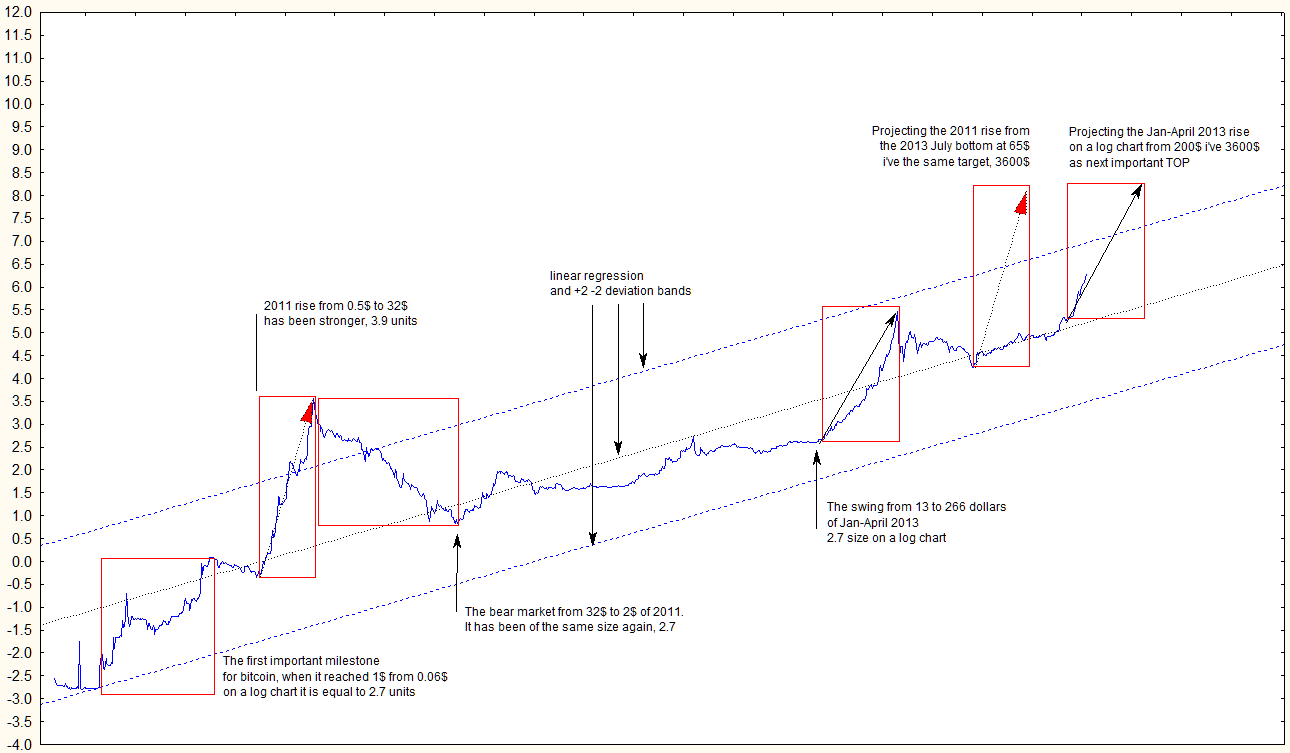
I drew a straight line on the graph represents the linear regression of the average prices recorded since August 2010. I added a prediction interval represented by the two lines above and below the linear regression. Bitcoin is in a price bubble whenever it goes above the upper deviation, on the contrary we can talk about prices significantly lower when we are under the line of the lower deviation, but so far it never happened for bitcoin to be so undervalued.
I’ve noticed that most of the time, important price swing are similar in size if we use a logarithmic scale to measure them, i have shown in the logarithmic graph the major movements of similar size and i used them to project what could be the next important long term top.
It may be noted that the next top might reach the $3600 price level, just above the current forecast that gives us the second deviation line of the linear regression, a perfect top in a buying climax situation which usually creates the market condition for a rapid fall in the price. At the moment to enter “bubble territory” we need to go above the 1100-1200$ price zone, just above the upper deviation line i’ve plotted on the chart. It is interesting also to note that the April 2013 top at 266$ has been under the upper deviation line while the 2011 top at 32$ has been well above and a true bubble which was followed by a bear market that has brought prices down to $ 2 in November 2011.
Because this market has been stronger then expected i revised my monthly range forecast to:
- Bitstamp: 450$ – 750$
- BTC-e: 430$ – 770$
- BTCchina: 3270 CNY – 5600 CNY
Strong support is always on the VWAP now at 320$-330$ or 2400 CNY.

Hi,
Thanks for your posts.
So you think that Bicoin might reach $3600 per unit? Am I correct?
Pj
seems convincing. i have also noticed the win-taking pattern. in principle always a loop of this: 10-50% increase (depending on the time scale your are looking at), then correction (or taking profits). on the log scale you sort of visualize the 10-50% increase-correction pattern. this of course translates directly into increasing target prices or price-deltas before profits are taken.
besides this technical analysis abstraction of the btc-trader/investor-minds, btc economy is rapidly growing. so maybe the bubble price range has to be increased.
Hi Enky,
Are you going to deploy more fiat currency now? Since you are only long btc with half a unit?
Enki, I hope that you are not full of bullshit this time man! I read your update when you said that you expect the market to retract from 410$ and sold my bitcoins at 400$, and despite it, bitcoin price continued to grow crazy. I bought them back at 720$ only by listening to you. You, no one, have no idea where this is heading, as much as you have been right, you have been wrong. If it weren’t for your “prediction”, I would be having 1000$ instead of 600$. Next time, be more careful what you write, some
don’t listen to him enky, your views are valuable and have always been helpful, keep up the good work!
Enky, thank you very much for this valuable service that you provide. Please ignore the haters. The rest of us are very grateful for your technical analysis. I hope you will continue to update us with your assessment of the market in the coming hours and days, as it appears the equivalent USD price at BTC China, and also MtGox USD, are well past your near-term target of $750/770.
To the idiot who is trying to blame Enky because he didn’t make as much money as his greed would like: I follow this blog religiously, and I’ve sold coins both at $300 and $500 during this rally. I stand by them as smart decisions. Stop being dumb.
Lol obviously if you knew about investing you should know that it’s up to you what you do with your money. Nobody ordered you to sell you yourself decided so
I think you’re not getting Enky… His market reviews has helped to take win-choices most of the times… He said buy at 270.. then I’ve sold at 330
Bitcoin price has doubled on Chinese market in the last 2 days. It has nearly doubled on mtgox as well in the last 3 days. I think that’s crazy…
It would be interesting to see some data from other things that bitcoin has been compared to plotted in a similar way. For example if you could get a hold of early gold prices. etc.
Thanks for your hard work.
It went from 800 to 900 in 20 minutes lol then big correction, I should have seen it coming lol
So China hit 6989 today, vastly suppressed your limit of 5600 just in a few hours. Don’t underestimate the madness of Chinese Tuhao and Dama. If they want something desperately, they won’t look at the price.
Thank you for your great analysis as always!
In the chart, I don’t really understand your placement of the projection from the April 2013 rally to the current one, if possible could you please explain that one a little more? It seems like even on your chart that was so different… it followed a really long calm period, it started well below your linear regression, etc. I just don’t understand why you placed the box where you did except to line it up with the 2011 projection. Why wouldn’t it be moved more left and down?
Thanks again for everything and sorry if this is a stupid question!
I see, thank you for the quick explanation!