Weekly Range Update

XBTUSD daily chart
XBTUSD daily chart

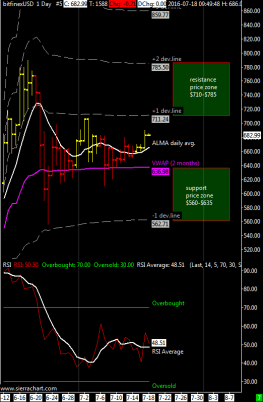
XBT / USD weekly range $ 635- $ 710 | ALMA daily moving average rose upward and the main support is the VWAP at about $ 635. XBTUSD resists above the VWAP for almost a month. The resistance price zone is $ 710-800, I think that XBTUSD will remain above $ 635 also this week with a first support at around $ 670, which corresponds to the ALMA moving average I use. It remains to be seen if market participants will manage to push the bitcoin price over the resistance at $ 710, the volatility after a period of contraction increased again and it did it by pushing up prices rather than downward, a positive note that leaves some hope for a break above $ 710.

The RSI oscillator remains in neutral position around 50, yet there seems to be a trend strong enough to move above $ 710, at least this week.

Mid-Week Range Update

imageXBT/USD range till sunday $625-$740 | daily moving average is bulllish but slowing down and main support is at VWAP near $625 , i expect less volatility these days while the halving is coming next saturday. Eventually sunday after the halving the market might spike up to the resistance price zone 740-800 usd.

RSI oscillator average is near oversold territory and reversing to the upside, i don’t expect this market to move below $620.

Weekly Range Update

XBTUSD Daily Chart Bitfinex

XBT/USD weekly range.forecast $610-$735 | daily moving average is bearish and main support is at VWAP near $610. XBTUSD is resisting above the VWAP after a quick test below the support i mentioned in the previous update around $585, support broken but quickly regained.

Resistance price zone is $735-860, i think that XBTUSD should remain above $610 but if it starts to spend too much time below it then i think that a new low is ahead in the support price zone $485-$610 with the RSI oscillator that which will probably become oversold by then.

Italian version here at Bitchanger

Weekly Range Update

2201XBT/USD weekly range.forecast $725-$870 | daily moving average is bulllish and main support is at VWAP near $580. XBTUSD continues to stay all the time above the first positive deviation line of the VWAP, a bullish behaviour.

In case of a strong price correction i’m looking at the $580 support as an interesting buying zone where to further increase my long-term position; position with a size of 3 units (150 btc) at an average price of $549.

Italian version of this update here at Bitchanger.

Mid-Week Range Update

XBTUSD Daily Chart @bitfinex

XBT/USD range till sunday $650-$770 | daily moving average is bulllish and main support is at VWAP near $540 but as i said earlier this week when the market is strong usually the first positive deviation line is very good as support, now at $650.

The odds now are for a retracement, i suggest to observe market behaviour around the alma moving average and first vwap dev.line both at around 650 dollars.

Weekly Range Update

weekly range en
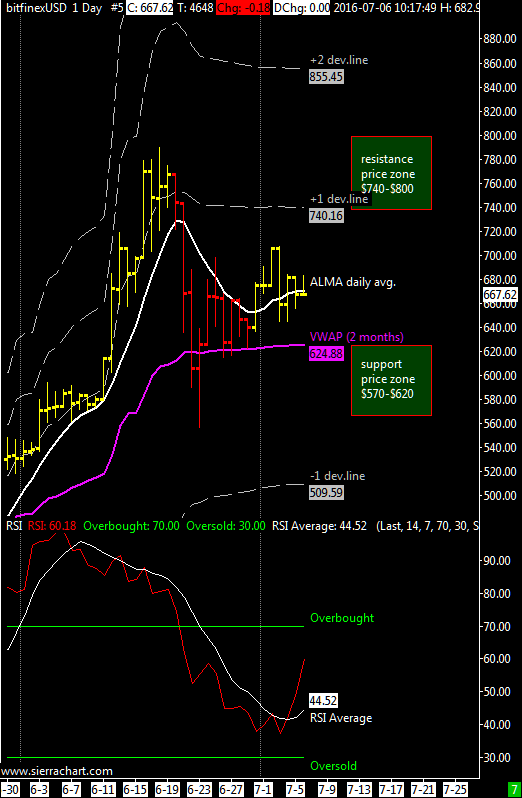
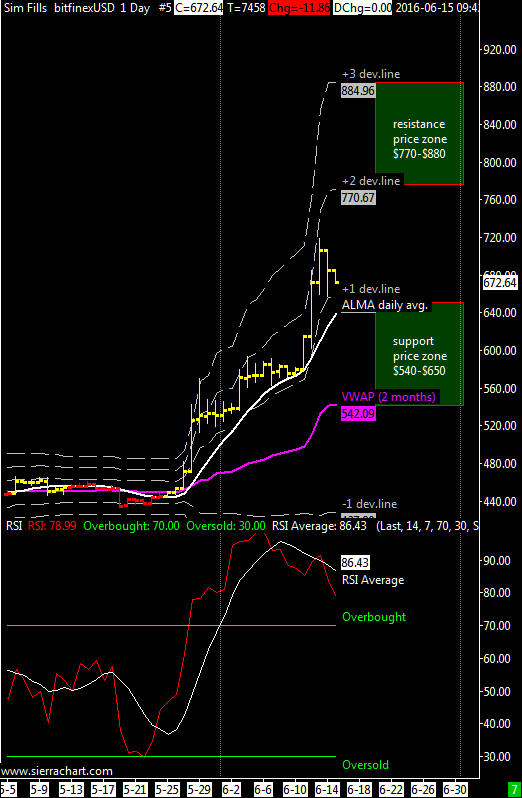
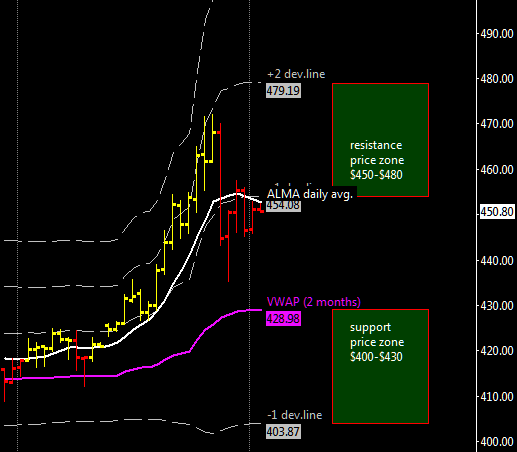
XBT/USD weekly range.forecast $610-$800 | daily moving average is firmly bulllish and main support is at VWAP near $520 although when the market is strong usually the first positive deviation line act as main support; now at $615.

In my previous weekly range update i was thinking that XBTUSD was going to add another 50$-60$  in the current up-cycle and it happened. Right now i’m observing market behaviour around the static resistance of $680, apparently XBTUSD is going to break this resistance and skip the scenario of a substantial price correction.

Aniway in case of a strong price correction i’m looking at the $520 support as an interesting buying zone where to buy the dip.

ITALIAN VERSION OF THIS ARTICLE HERE AT BITCHANGER.COM

Weekly Range Update

BTCUSD daily chart

XBT/USD weekly range.forecast $540-$650 | daily moving average is still bulllish after the strong spike. Support is at VWAP near $480. Volatility remains high togheter with RSI oscillator now at 92.
Although support is at VWAP near $480 i think that $540 should hold in case of a retracement.

I think that XBTUSD will probably add another 50$-60$  in the current up-cycle before a substantial correction takes place.

In case of a price correction i’m looking at the $480-$540 price range as an interesting buying zone although as i said before $540 should hold.

Italian version of this article here at bitchanger.com

Weekly Range Update

bitfinexUSD 1439 Min 59 Sec #5 2016-05-30 07_59_47.790XBT/USD weekly range.forecast $495-$570 | daily moving average is bulllish after the strong spike. Support is at VWAP near $460. Volatility has increased and after an initial bearish trap XBTUSD rose well above the VWAP, RSI is high and it hadn’t been in overbought territory for a while this should increase the probability to see a retracement from here. Strong resistance is always at around $570.
Although support is at VWAP near $460 i think that $495 should hold in case of a retracement.

Italian version here at bitchanger


Weekly Range Update

XBT/USD weekly range.forecast at $425-$460 | daily moving average is bearish. Resistance is at VWAP near $445. Volatility increased but i think that we are seeing a bear trap, i expect an upmove that will carry XBTUSD just above the VWAP, RSI is low and it hadn’t been in oversold territory for a while this should increase the probability to see a rebounce from here. Strong resistance is always at around $480.

Generally speaking i think that there are no reasons to see the recent drop as a dump, in my opinion bitcoin fundamentals are looking strong and there is a lot to be bullish about this summer with segwit coming and halving.

bitfinexUSD  1439 Min 59 Sec   #5 2016-05-23  09_36_59.648

Italian version of the update here

Weekly Range Update

XBT/USD weekly range.forecast $435-$460 | daily moving average is bullish after the upmove of May 6. Strong support is always at $435 near the short term VWAP and there is also a recent double bottom. In case of another upmove strong resistance is at $485.

image

With my metatrader 4 price regression channels i’ve a similar picture with support at $424-435 and resistance at $463-475 price zones. Yellow line is the same average i use on sierrachart, ALMA moving average.

BTCUSDDaily

Weekly Range Update

XBT/USD weekly range.forecast $430-$450 | daily moving average is slightly bearish and strong support is at $430 near the short term VWAP. XBTUSD has broken to the upside from the previous congestion range ($400-$430) although now it is a bit weak and could probably test the VWAP at $430. For today support is at $445.

chart