Short Tem Update: KAMA Levels

KAMA Levels
KAMA Levels

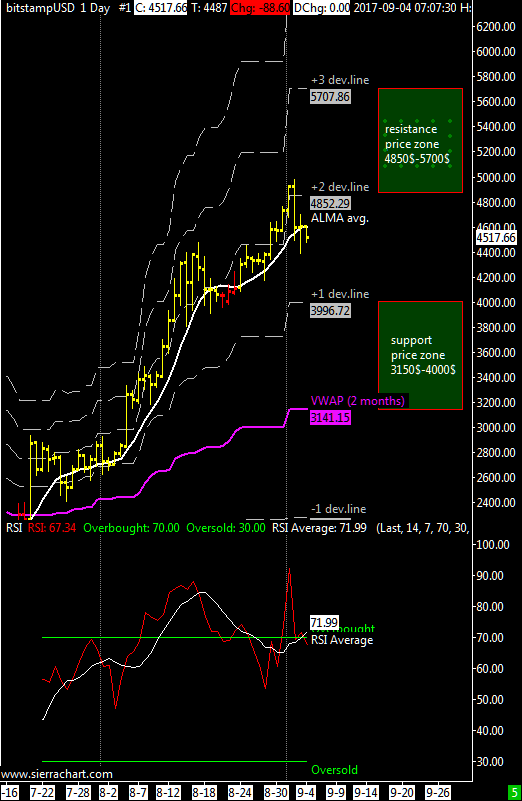
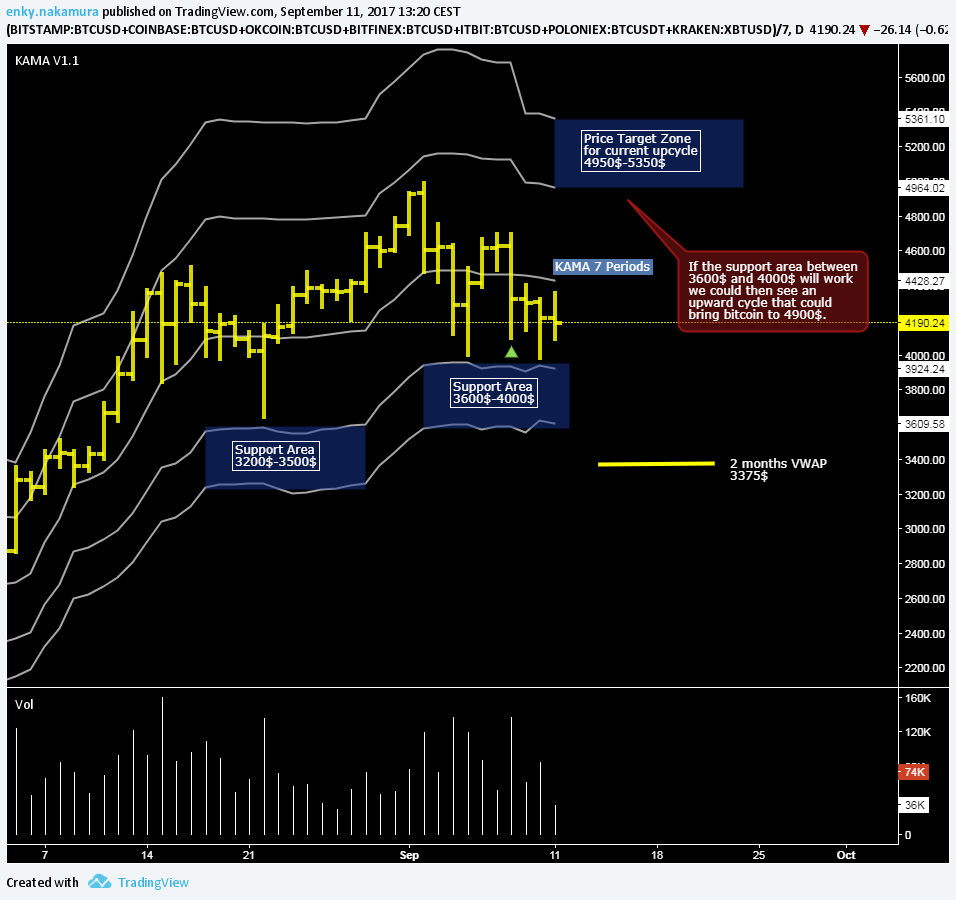
XBT/USD weekly price range at 4000$-4950$ | The price range for this week is not very different from last week, we have seen until now a weak September with the price drop from the all time high of 5000$ and despite several negative news the XBTUSD has remained above 4000 dollars.
As you can see in the graph the support area using my KAMA indicator ranges from $3600 to $4000, the resistance zone from $4950 to $5350.
If the 4000$ support will work, then an upward cycle with a minimum target of 4950$ could start, otherwise the 2-month VWAP around 3400$ is an important support.
I think it’s unlikely to see bitcoin under the vwap at 2 months for this and also next week, otherwise it would mean that on the weekly chart a medium-long term correction has started; however it’s still early to say and let see if XBTUSD can stay above $4000 this week.

In case of a unexpected catastrophic news, the support area on the weekly chart is 2000-2500 USD

ITA Version here

Weekly Range Update

XBTUSD dailychart
XBTUSD dailychart

XBT/USD weekly price range at 4000$-4850$ |The XBTUSD cross has seen a correction during the weekend moving back below the second line of price deviation, I see as important support for this week the price level at 4000 dollars, for those who are willing to buy I would suggest to observe the behavior of the XBTUSD cross around that level.
As already mentioned in the previous update, we must not forget that bitcoin remains in a strong position and has been long standing above the VWAP’s first line of deviation and that therefore these corrections are not worrying if limited to 2-3 days.

The average of the RSI oscillator is above the threshold of 70, confirming that the bearish signal of August 26-27 was a false signal as I assumed previously. This indicator is not recently giving clear indications because despite all XBTUSD is maintaining an upward trend without excessive volatility, elements that compromise the proper functioning of any technical oscillator.

In the event of an extreme fall, the support area is 2300-2800 USD

ITA version here.

Weekly Price Range Update

eng
XBTUSD daily chart – VWAP + deviation levels

XBT / USD weekly price range is 1150$-1335$ | The market is still in a strong position above the VWAP and is near the resistance level of the previous week (1235$), if a break materializes above the first resistance level at 1245$ there is room for an attack to the all-time high around 1350 $; as support to my hypothesis there is the fact that the last two bottoms happened at 750$ and 900$, two higher lows reflecting the fact that the underlying trend is still firmly upward and it is causing higher highs and lows. With this logic the next maximum should be above 1300$-1350$.

The ALMA average is bullish and the RSI has entered overbought zone. From now on there is a tangible risk that a maximum on the daily chart is forming especially if there is a strong increase of volatility.

In cases of extreme drop the support area is now 700-875 USD.

ITA version here

Weekly Range Update

Daily Chart XBTUSD
XBTUSD daily Chart

XBT / USD weekly price range is $720-$800 | Nothing new also for this week with the main resistance ($ 800) at the second deviation line above the VWAP while the support is the VWAP at about $ 720. As long as the bitcoin will maintain this upward tendency with reduced volatility the levels of support and resistance will not change much, going hand in hand with the advance of the price.

The average daily RSI oscillator is entering the overbought zone. The RSI on the weekly chart is in overbought and above the threshold of 70; despite being overbought for some weeks I think that a maximum on the weekly chart has not yet been done.

In case of extreme drop the support is the price area between 485 and $ 575 US.

XBTUSD alternative template

Let’see now the daily chart template I use with Metatrader 4. As you can see the price levels are similar to VWAP and its deviation lines. At the moment the price is consolidating above the median line of the price regression channel preparing for a move up to $810 in accordance with the $800 resistance provided by the second deflection line of the VWAP. The area around 720-730 dollars will provide support in case of correction.

Italian version here at bitchanger.