Weekly Range Update

eng
Daily Chart XBTUSD @bitstamp

XBT / USD weekly price range $600-$635 | daily ALMA moving average is still up although its pace is slow, the main resistance remains the second price deviation line  above the VWAP at $ 635 while the support is always the VWAP at $ 565, the situation is not changing much from week to week with this slow buildup between 600 and 615 dollars.

I think is still valid the possibility that this accumulation will resolve with a move above 635 dollars because the ALMA average on the weekly chart has turned upward but again with not much speed. For those wishing to go short I recommend to wait at least $ 675 before trying and however i don’t recommend to do it if bitcoin reaches $ 670-675 in less than 24 hours.

The average RSI oscillator is approaching overbought area and this is a factor that worries me a bit because it could put an end to this slow rise that has lasted since September 22 when it did a small minimum at $593.

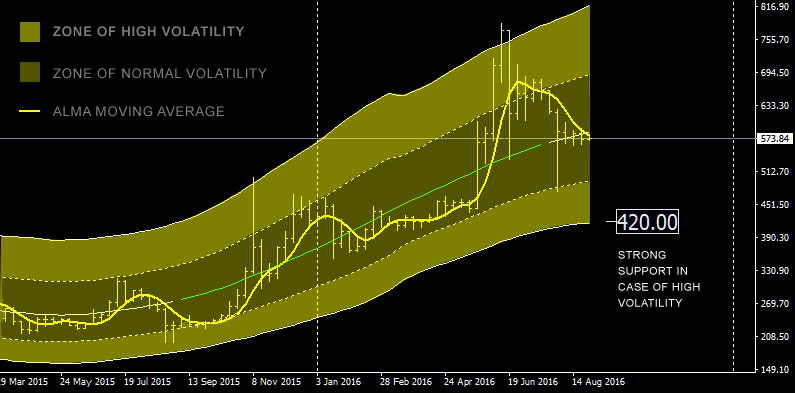
In the event of a sharp fall, as said many times is always very valuable the support around $420, now at $430 because the weekly tendency is still up and the support grow with time.

Italian version here at Bitchanger.com

Weekly Range Update

eng
Daily Chart XBTUSD @bitstamp

XBT / USD weekly range $598 – $634 | ALMA daily moving average is bullish and the main resistance is the second price deviation line above the VWAP @$630 while the support is always the VWAP @$570 although i think it will remain above 595$ also this week.

A rise above $630 is close for the same reason i told you severa times in the past weeks, XBTUSD is slowly accumulating and the weekly ALMA moving average already turned up but its slope is very low for now, in the upcoming weeks there should be a final breakout above $630.

The RSI oscillator has moved to an equilibrium point around 50 and there is enough room for more upside movement till the overbought zone.

In the event of a sharp fall, as said many times is always very valuable the support around $420.

Italian version here at Bitchanger.com

Long Term Update: Weekly View

eng
XBTUSD Weekly chart with price regression channel

This is a weekly chart since the bottom of March, 2015; the underlying weekly tendency is still up since then.
Inside this long term up channel there are secondary tendencies or cycles clearly visibile and highlighted by the alma moving average.

Last up cycle ended on the top just outside the high volatility zone in June 2016. After 3 months we are still in a secondary  down cycle inside a big up cycle. As i’ve told you in previous updates the maximum extension of this down cycle is at $420 as indicated in the above chart, i doubt we will see weakness below this important level.

At the moment the price is exactly at the middle point of the price regression channel and it’s very hard to say which direction it’ll take, in any case if there will be a new crash down to $420 i’ll further increase my long term position; at the same time if XBTUSD start to stay consistently below $420 i’ve to conclude that the long term up cycle is over and a bear market is ahead.

As i’ve said many times in the past years i don’t believe in a prolonged bear market because bitcoin and its network are healthy and just at the beginning of their life. Key is patience.

Volatility is back and in the right direction

XBTUSD touched my weekly resistance at around $480, i think this resistance is temporary and considering the huge amount of volatility increase there are chance to see higher prices ahead. It’s time to switch to a weekly chart to better understand where is the first decent resistance .

chart-xbtusd-weekly

Above you can see a weekly chart of XBTUSD using an average of 5 exchanges. I plotted the bollinger bands and highlighted 3 breakout bars on point 1,3,4.

XBTUSD did a first breakout bar above the upper bollinger band on mid July 2015 (point 1 on the chart) but immediately turned back inside the bar, typical bearish pattern. At this point a bearish reaction started and ended at the lower bollinger band (point 2 on the chart) .
From here the true movement started with a clean breakout bar (Nov. 2015 point 3 on the chart).

Now we are seeing the same breakout bar (point 4 on the chart) but i can’t say yet if it is a legit or a fake one. Judging from what happened since Jan of this year with XBTUSD doing a long sequence of higher lows i’m tempted to say that this market is strong and probably it will break above 500 dollars; the next 1-2 weeks are crucial to see if this breakout is valid or not.

In january i was telling you that a good resistance for the whole year was $760 and it is still valid, there is 1% possibility to move above $760, 5% to go above $630 and 30% to pass $550. In case of a strong move above $500 the possible targets are these.