Weekly Range Update

XBTUSD dailychart
XBTUSD dailychart

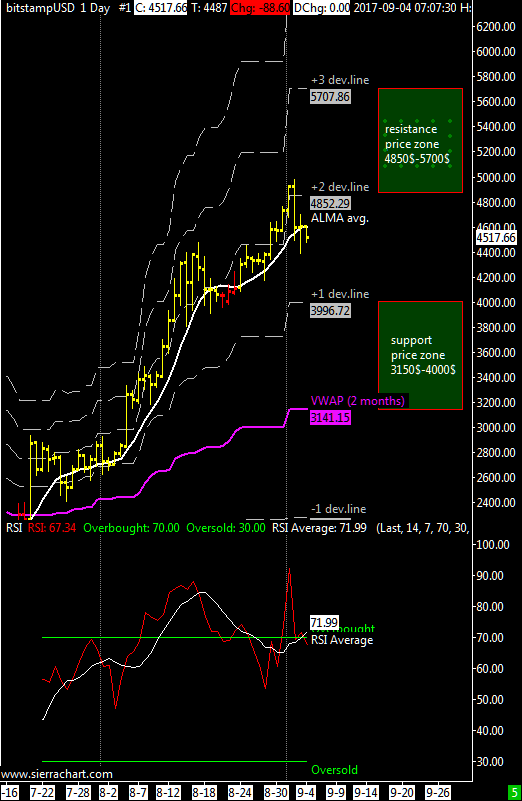
XBT/USD weekly price range at 4000$-4850$ |The XBTUSD cross has seen a correction during the weekend moving back below the second line of price deviation, I see as important support for this week the price level at 4000 dollars, for those who are willing to buy I would suggest to observe the behavior of the XBTUSD cross around that level.
As already mentioned in the previous update, we must not forget that bitcoin remains in a strong position and has been long standing above the VWAP’s first line of deviation and that therefore these corrections are not worrying if limited to 2-3 days.

The average of the RSI oscillator is above the threshold of 70, confirming that the bearish signal of August 26-27 was a false signal as I assumed previously. This indicator is not recently giving clear indications because despite all XBTUSD is maintaining an upward trend without excessive volatility, elements that compromise the proper functioning of any technical oscillator.

In the event of an extreme fall, the support area is 2300-2800 USD

ITA version here.

Weekly Range Update

XBTUSD dailychart
XBTUSD dailychart

XBT / USD weekly price range at 2100$-2900$ | The VWAP is just below 1700$ and the XBTUSD cross is always above it confirming mid-term bullishness.

I have told you many times that when a market is in a very strong position it can move between the first and second price deviation line except for rare cases where it can be between the second and the third line.
From a couple of days back it’s above the second price deviation line and I think that the current rally will continue pushing the bitcoin towards 2900$.

The average of the RSI oscillator is just below the overbought area and I think that bitcoin will ignore this indicator that may remain overbought for a certain period of time due to the fact that the dominant timeframe is the weekly one and as mentioned earlier I think this aspect can push bitcoin over the previous maximum of 2750$.

In case of extreme fall, the support area is 1050-1450 USD.

ITA version here.

Weekly Range Update

eng
Daily Chart XBTUSD

XBT / USD weekly price range is 865$-965$ | The XBTUSD cross has moved above the VWAP regaining a position of strength, for this week the main resistance is the price zone between the first and the second deviation line or the 965$-1070$ price range; This technical rebound should stop in this price range (970$-1070$ ) now we need to wait to see where will be done the next relative maximum to understand how it is positioned in the medium term, given the situation of the weekly chart I expect that the next top will be lower then the other one of 3 January done approx at 1170$.

As support it is valid the first negative deviation line VWAP at around $ 765 although I feel that the last minimum done at $750 is confirmed and i think to be right considering now the VWAP at 865$ as main support for this week and probably the next one.

The daily RSI oscillator average has reversed to the upside but without going into oversold first, thus great buying opportunities have not yet been materialized.

In cases of extreme fall the support area run from 590 to 680 USD.

ITA version here at bitchanger.com

Short Term Update: 7 days VWAP

eng
XBTUSD H2 Chart Bitstamp – VWAP 7 Days

XBTUSD remains pointed higher, but may see short-term weakness down to the 7 days VWAP at 1030$ (1040$ for kraken and 1000$ for btce exchange).

Waiting for a dip to support before looking for fresh longs; risks of momentum slowing is on the rise without retracement if price moves below the short term VWAP.

RSI is close to oversold and i think that in the next hours there should be an intraday bottom, good opportunity to buy if market stays above VWAP.