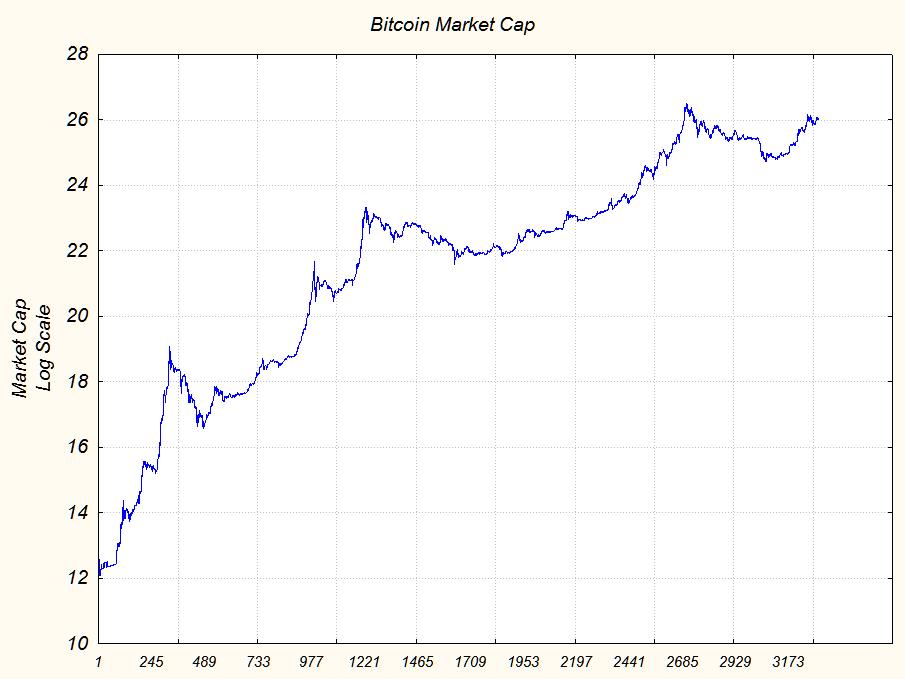
For those who follow me on twitter know that my bitcoin price model v1.1 that I presented on this blog last September 2019 has been invalidated by the recent low of March 13 at $3850. I use 95% confidence level bands around my model forecast and that day the lower confidence level has been violated thus invalidating my model.
Since that day I have at various times pondered how to improve my old model and I recycled an idea that came to my mind last year when I presented the first model.
This idea is not to use the time factor to calculate the price of bitcoin but instead use the number of existing bitcoins that as you know grows over time and halves about every 4 years (until now it happened in 2012,2016 and 2020).
In doing so I discovered that there is a fairly strong linear relationship between the logarithm of the bitcoin price and the number of existing bitcoins at that particular moment.
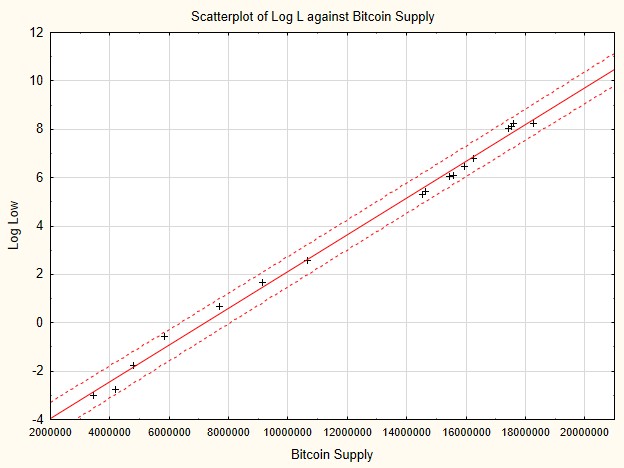
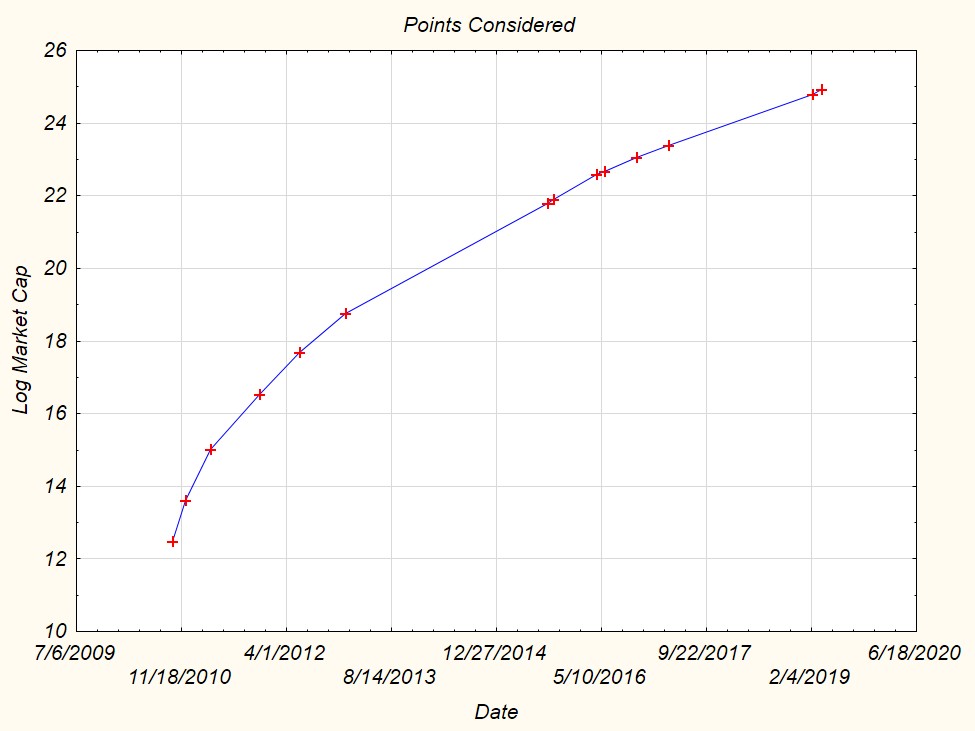
With the software i use isn’t complicated to find a formula that approximate all the selected bitcoin bottoms.
This is the dataset used to compute the model:
| Date | Low | Bitcoin Supply |
| 2010/07/17 | $0.05 | 3436900 |
| 2010/10/08 | $0.06 | 4205200 |
| 2010/12/07 | $0.17 | 4812650 |
| 2011/04/04 | $0.56 | 5835300 |
| 2011/11/23 | $1.99 | 7686200 |
| 2012/06/02 | $5.21 | 9135150 |
| 2013/01/08 | $13.20 | 10643750 |
| 2015/08/26 | $198.19 | 14536950 |
| 2015/09/22 | $224.08 | 14637300 |
| 2016/04/17 | $414.61 | 15439525 |
| 2016/05/25 | $444.63 | 15582350 |
| 2016/10/23 | $650.32 | 15943563 |
| 2017/03/25 | $889.08 | 16235100 |
| 2019/02/08 | $3,350.49 | 17525700 |
| 2018/12/15 | $3,124.00 | 17423175 |
| 2019/03/25 | $3,855.21 | 17608213 |
| 2020/03/13 | $3,850.00 | 18270000 |
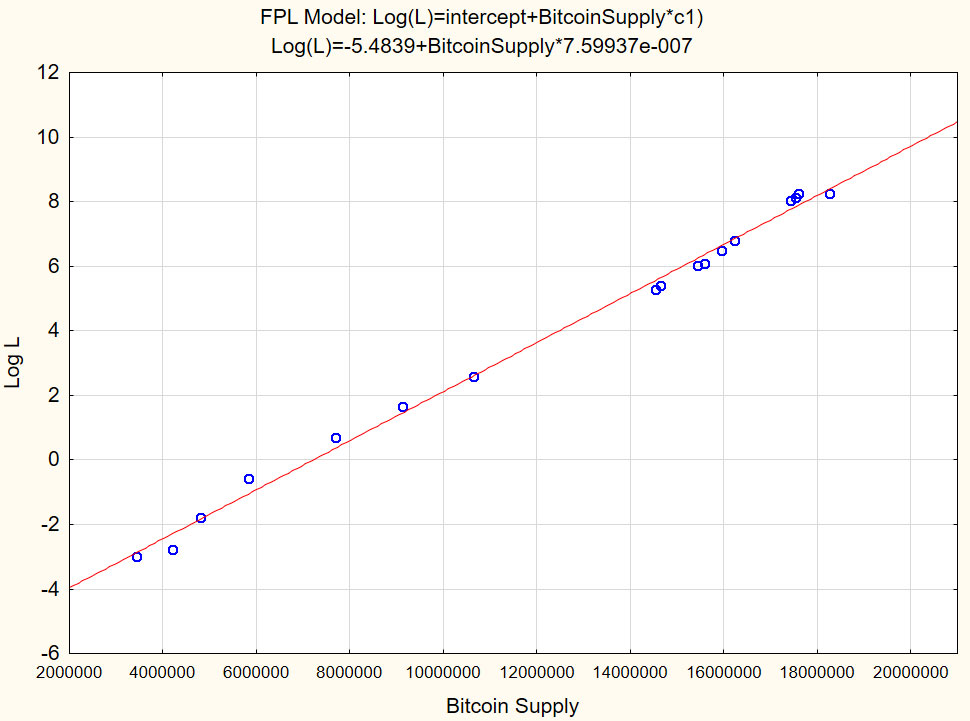
The Formula is a very simple one, a first order price regression between log(Low) and Bitcoin supply:

Where:
FPL = expected line where bitcoin is fairly priced
intercept = a costant
c1 = another coefficient that defines the slope of the Bitcoin supply input.
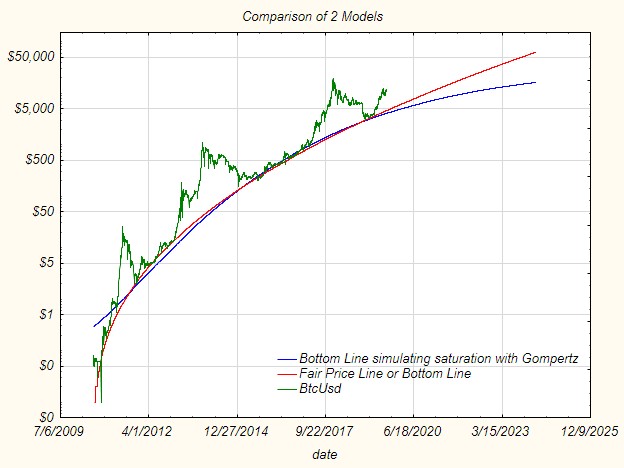
Here’s the resulting model after computing the parameters of the above formula.
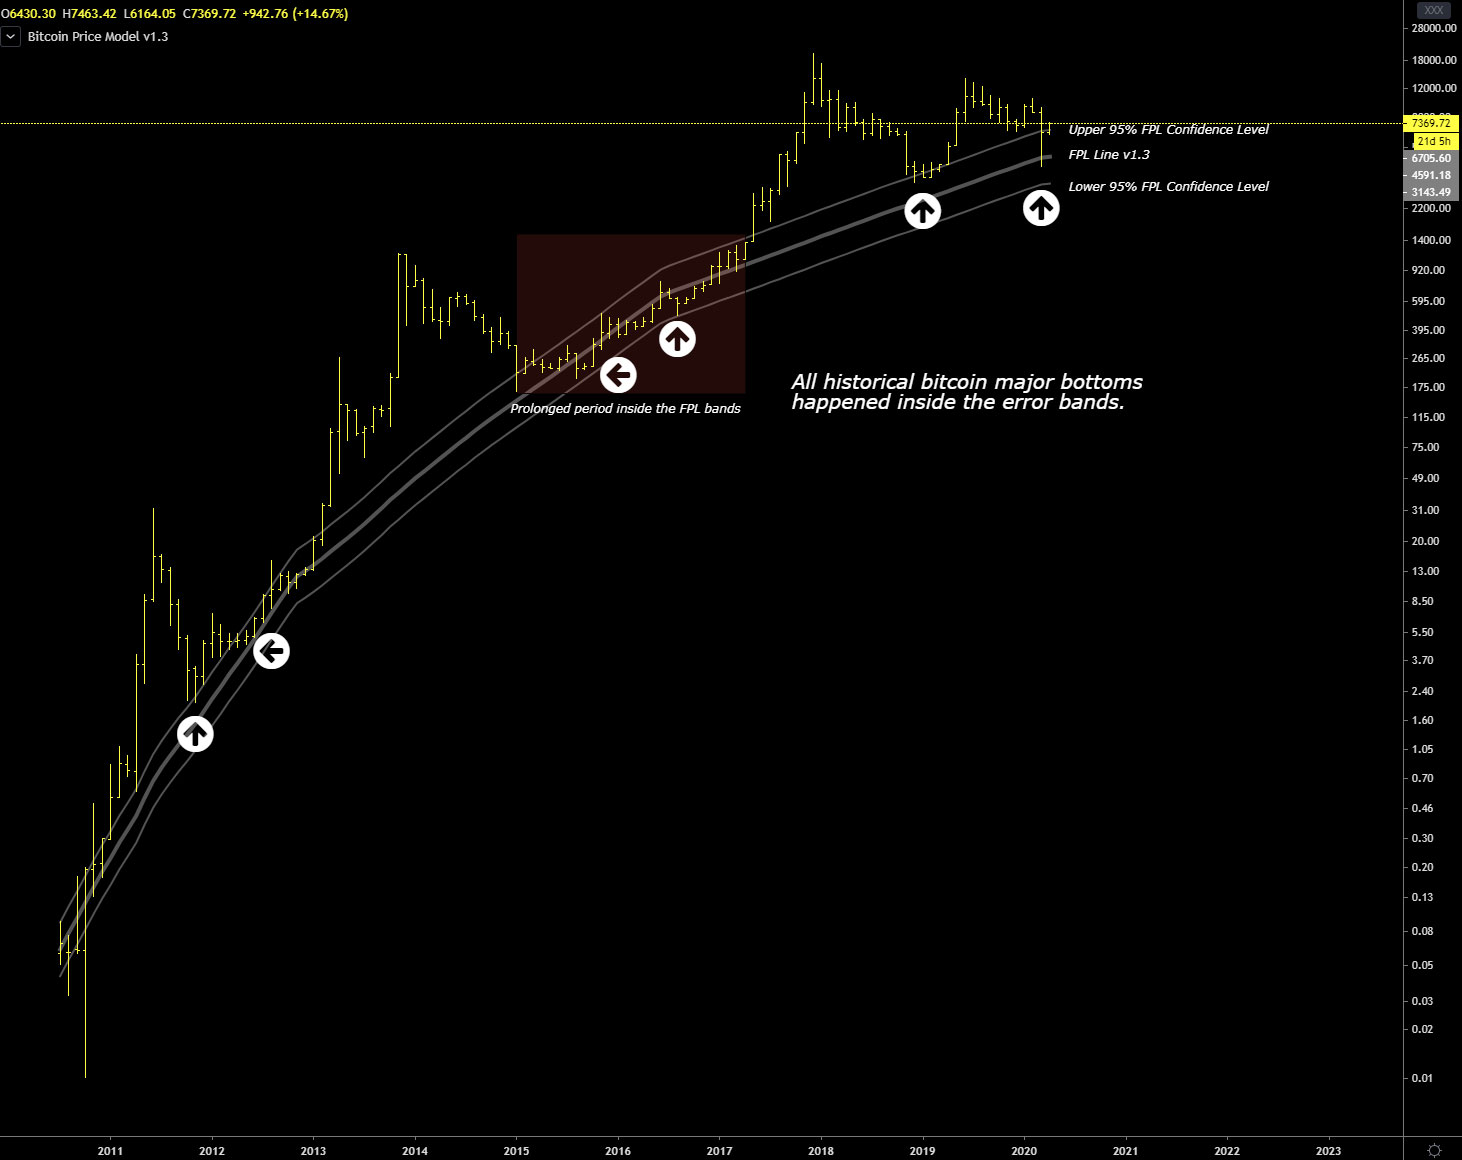
This is the new bitcoin price model “FPL Line” v1.3 applied to a monthly bitcoin/usd chart: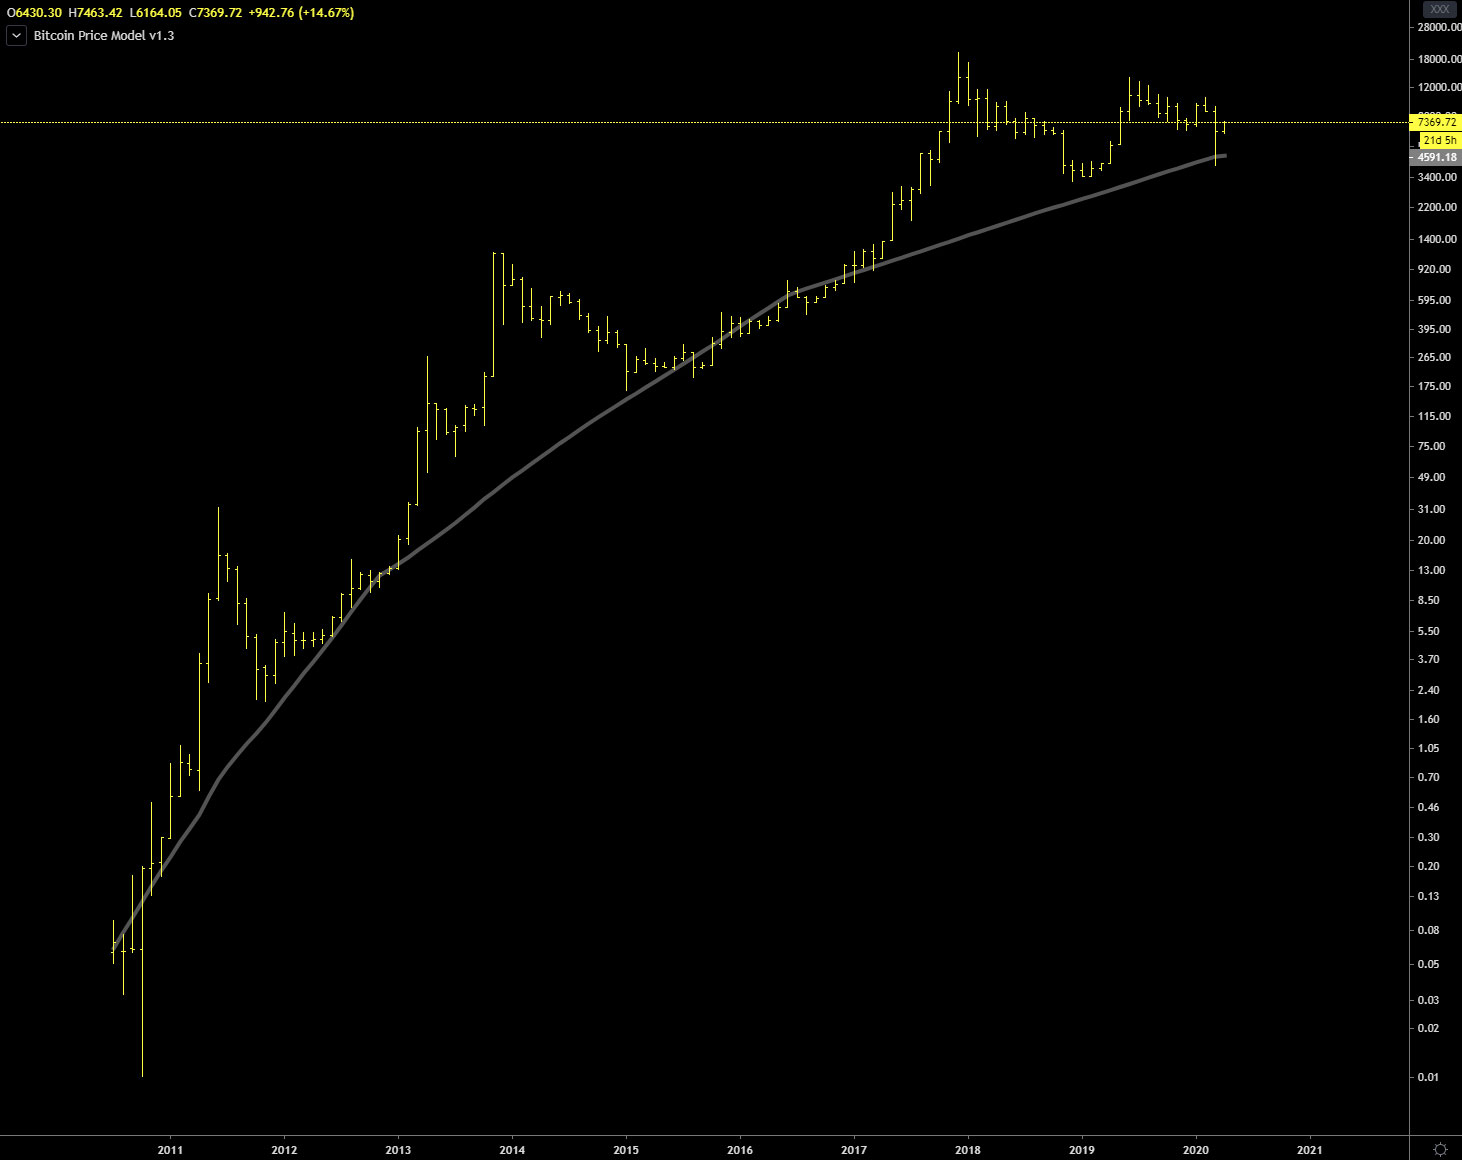
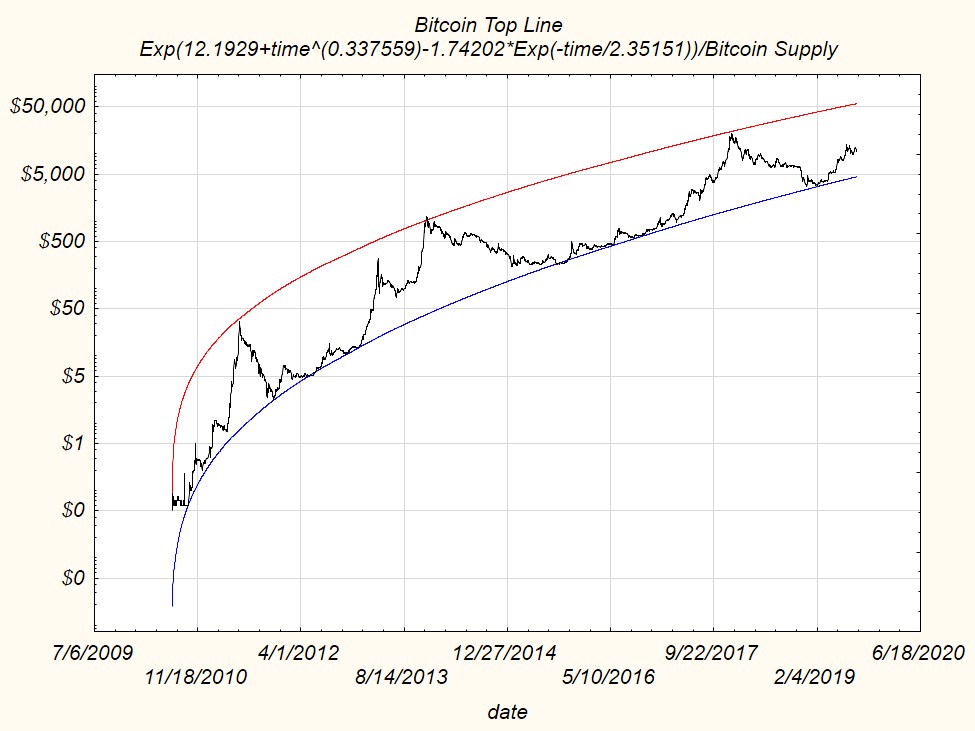
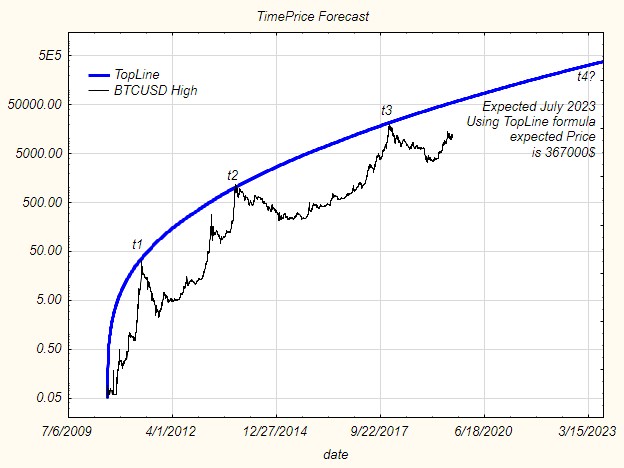
Next Step: Computing the formula for the TopLine
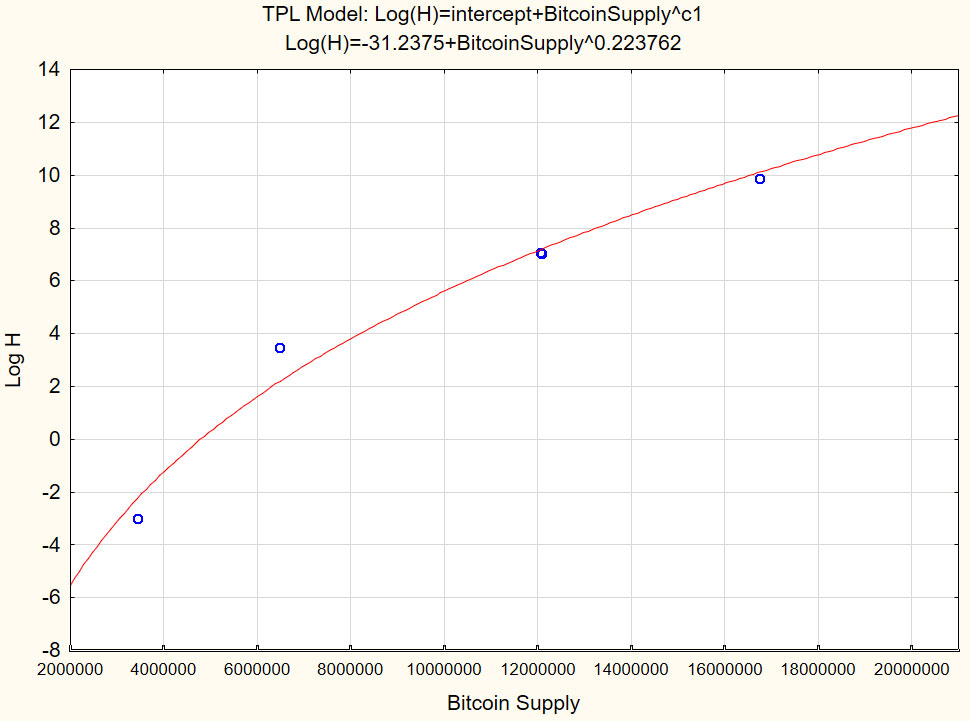
The formula for computing the Top is:

Where:
TopLine= is the forecasted price where the next long term top might be.
intercept = a costant
c1 = another coefficient that defines at which pow the bitcoin supply is elevated
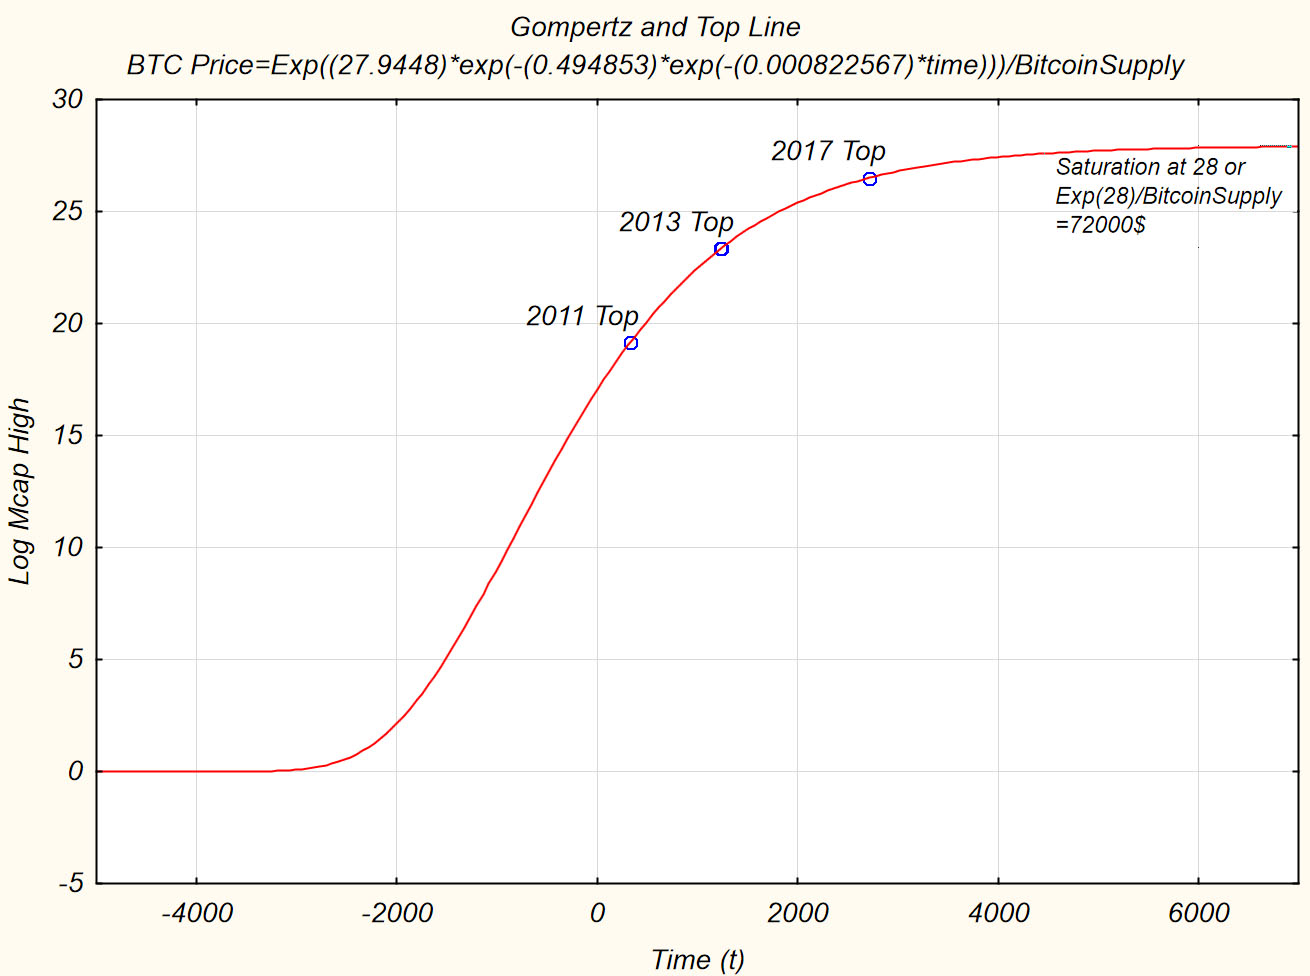
This formula is different from the one used to compute the FPL or bottom line. I’ve seen that there is not a strong linear relationship betweel the logarithm of important Bitcoin Tops and the Bitcoin supply, so i decided to switch to the formula used for the old model and it works better.
This is the dataset used to compute the model:
| Date | Price | Bitcoin Supply |
| 2010/07/17 | $ 0.05 | 3436900 |
| 2011/06/08 | $ 31.91 | 6471200 |
| 2013/11/30 | $ 1,163.00 | 12058375 |
| 2013/12/04 | $ 1,153.27 | 12076500 |
| 2017/12/19 | $ 19,245.59 | 16750613 |
Here’s the resulting model after computing the parameters of the above formula.
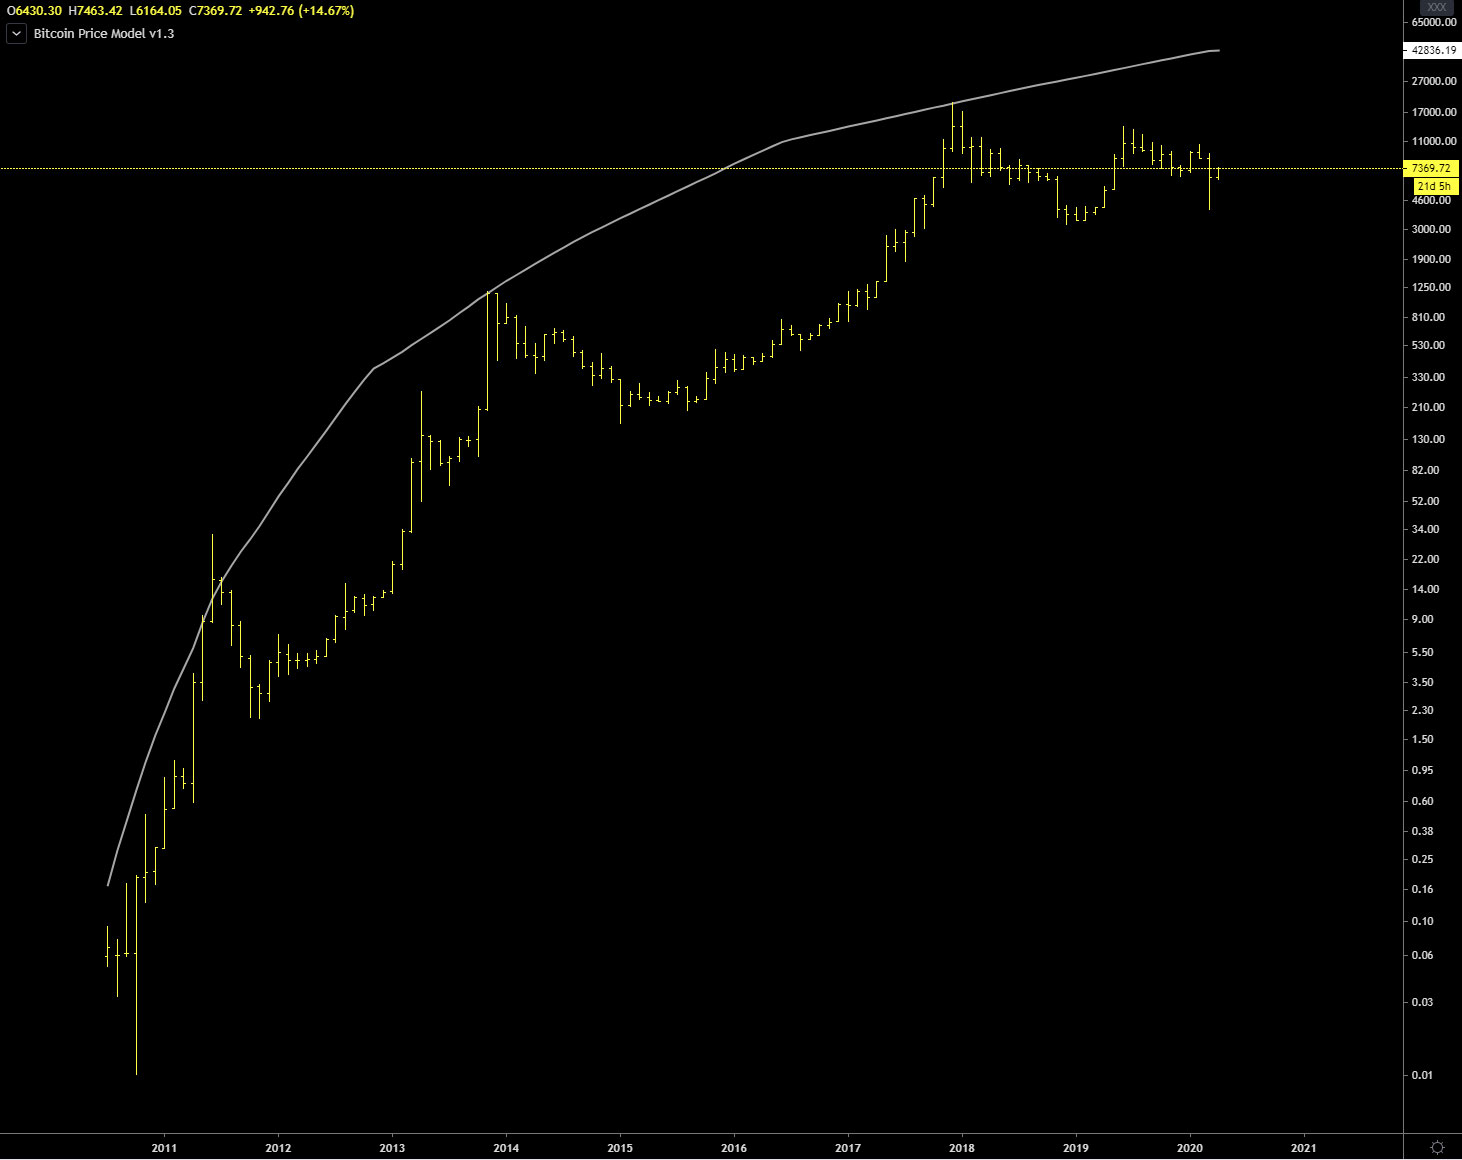
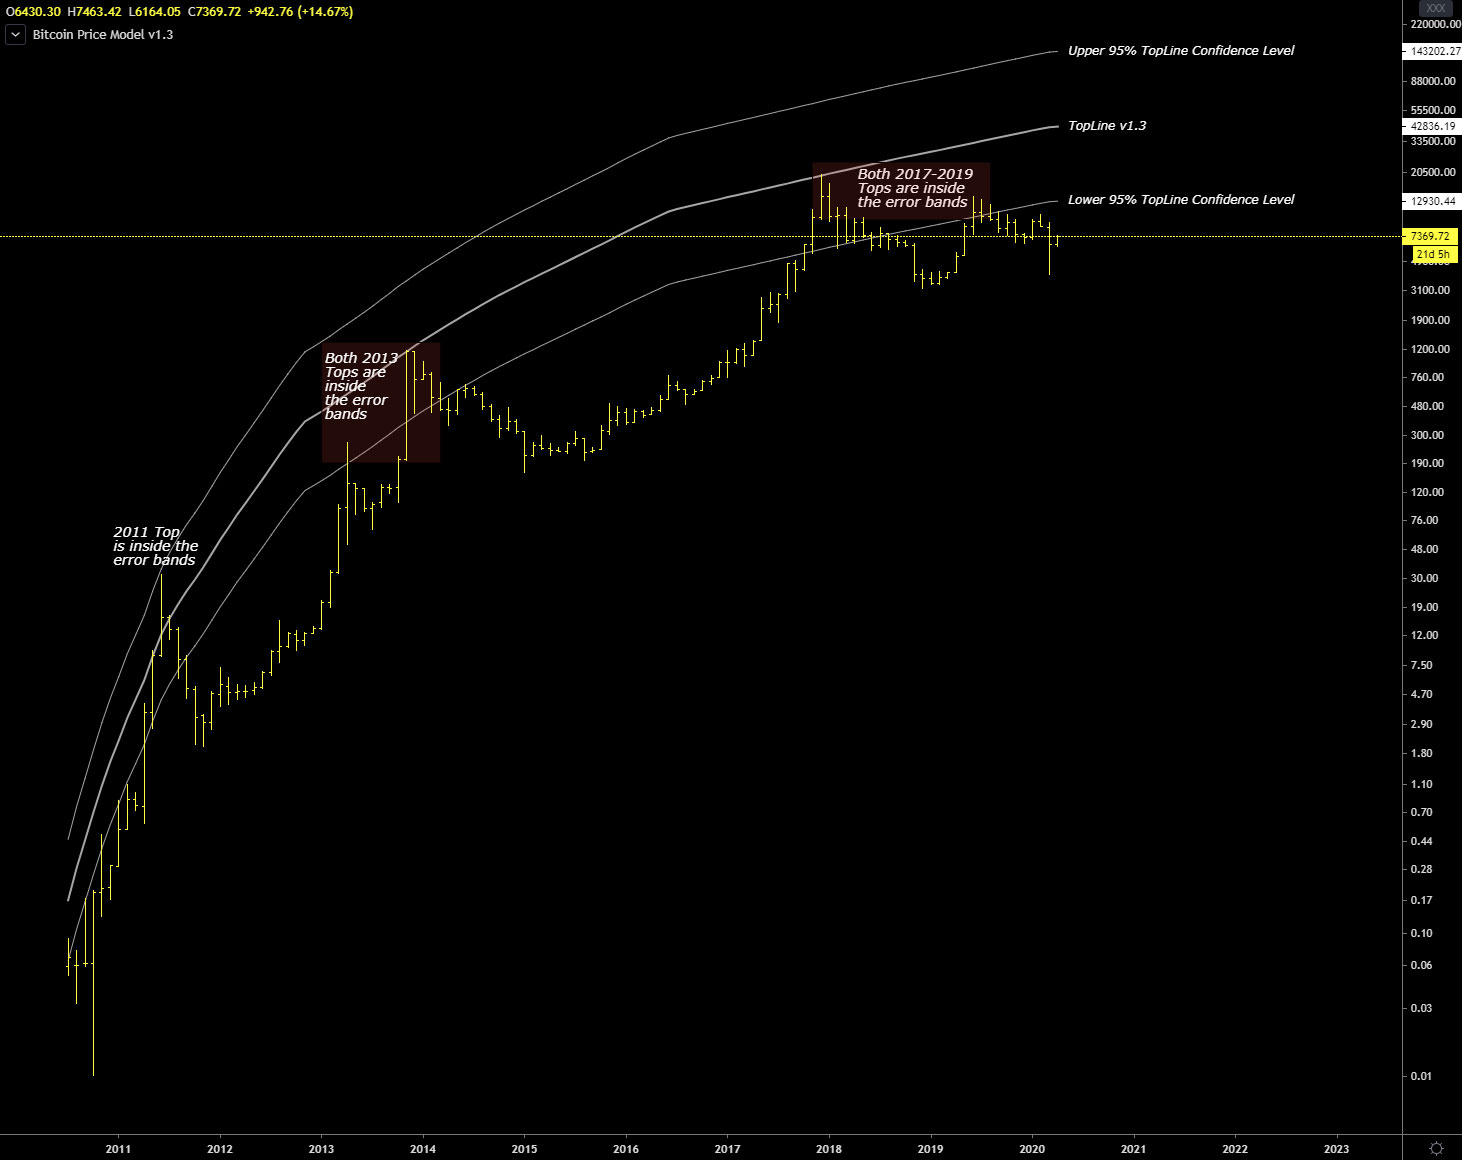
This is the new bitcoin price model “Top Line” v1.3 applied to a monthly bitcoin/usd chart:
95% Confidence Error Bands
With the indicator that i give you for TradingView i included also the error bands.
This are the error bands for the TopLine:
And for the bottom line or FPL (FairPriceLine)
It is quite obvious that with fewer points available the error bands for the TopLine are wider and less accurate compared to the FPL error bands where I have more points (17 instead of 5).
TradingView Indicator
I have also included an indicator for TradingView to give you the opportunity to experience the concepts and model illustrated in this update. You can also check the code and/or modify it as you like.
On April 10th, 2020 tradingview staff decided to censor my indicator and threatened to close my account, because of this i publish here the code so you can create your own indicator by yourself.
Bitcoin Model v1.3 Sourcecode:
Code is also available at pastebin
Remember to add a “TAB” key once before stock (line 10 and 13), in the process of copying and pasting data back and forth from tradingview the tab key is gone probably because there is not a tab code in HTML.
//@version=2
study(“Bitcoin Price Model v1.3”, overlay=true)
//stock = security(stock, period, close)
stock = security(“QUANDL:BCHAIN/TOTBC”,’M’, close)
if(isweekly)
//insert “TAB” key before stock
stock = security(“QUANDL:BCHAIN/TOTBC”,’W’, close)
if(isdaily)
//insert “TAB” key before stock
stock = security(“QUANDL:BCHAIN/TOTBC”,’D’, close)
FairPriceLine = exp(-5.48389898381523+stock*0.000000759937156985051)
FairPriceLineLoConfLimit = exp(-5.86270418884089+stock*0.000000759937156985051)
FairPriceLineUpConfLimit = exp(-5.10509377878956+stock*0.000000759937156985051)
FairPriceLineLoConfLimit1 = exp(-5.66669176679684+stock*0.000000759937156985051)
FairPriceLineUpConfLimit1 = exp(-5.30110620083361+stock*0.000000759937156985051)
plot(FairPriceLine, color=gray, title=”FairPriceLine”, linewidth=4)
show_FPLErrorBands = input(true, type=bool, title = “Show Fair Price Line Error Bands 95% Confidence 2St.Dev.”)
plot(show_FPLErrorBands ? FairPriceLineLoConfLimit : na, color=gray, title=”FairPriceLine Lower Limit”, linewidth=2)
plot(show_FPLErrorBands ? FairPriceLineUpConfLimit : na, color=gray, title=”FairPriceLine Upper Limit”, linewidth=2)
show_FPLErrorBands1 = input(false, type=bool, title = “Show Fair Price Line Error Bands 68% Confidence 1St.Dev.”)
plot(show_FPLErrorBands1 ? FairPriceLineLoConfLimit1 : na, color=gray, title=”FairPriceLine Lower Limit”, linewidth=1)
plot(show_FPLErrorBands1 ? FairPriceLineUpConfLimit1 : na, color=gray, title=”FairPriceLine Upper Limit”, linewidth=1)
TopPriceLine = exp(-30.1874869318185+pow(stock,0.221847047326554))
TopPriceLineLoConfLimit = exp(-30.780909776998+pow(stock,0.220955789986605))
TopPriceLineUpConfLimit = exp(-29.5940640866389+pow(stock,0.222738304666504))
TopPriceLineLoConfLimit1 = exp(-30.3683801339907+pow(stock,0.221575365176983))
TopPriceLineUpConfLimit1 = exp(-30.0065937296462+pow(stock,0.222118729476125))
plot(TopPriceLine, color=white, title=”TopPriceLine”, linewidth=2)
show_TOPErrorBands = input(false, type=bool, title = “Show Top Price Line Error Bands 95% Confidence 1St.Dev.”)
plot(show_TOPErrorBands ? TopPriceLineLoConfLimit : na, color=white, title=”TopPriceLine Lower Limit”, linewidth=1)
plot(show_TOPErrorBands ? TopPriceLineUpConfLimit : na, color=white, title=”TopPriceLine Upper Limit”, linewidth=1)
show_TOPErrorBands1 = input(false, type=bool, title = “Show Top Price Line Error Bands 68% Confidence 1St.Dev.”)
plot(show_TOPErrorBands1 ? TopPriceLineLoConfLimit1 : na, color=white, title=”TopPriceLine Lower Limit”, linewidth=1)
plot(show_TOPErrorBands1 ? TopPriceLineUpConfLimit1 : na, color=white, title=”TopPriceLine Upper Limit”, linewidth=1)
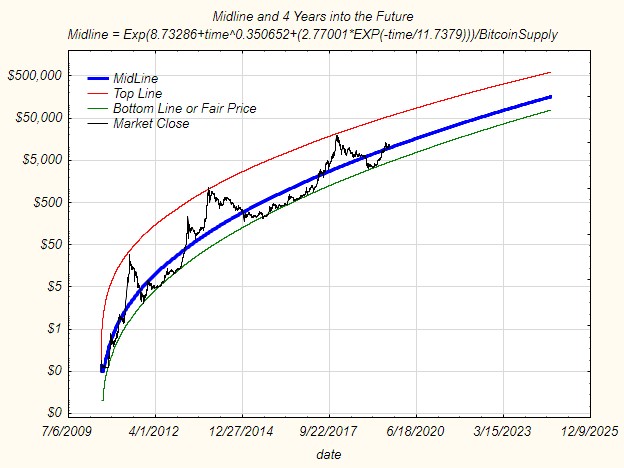
Forecast up to 2032
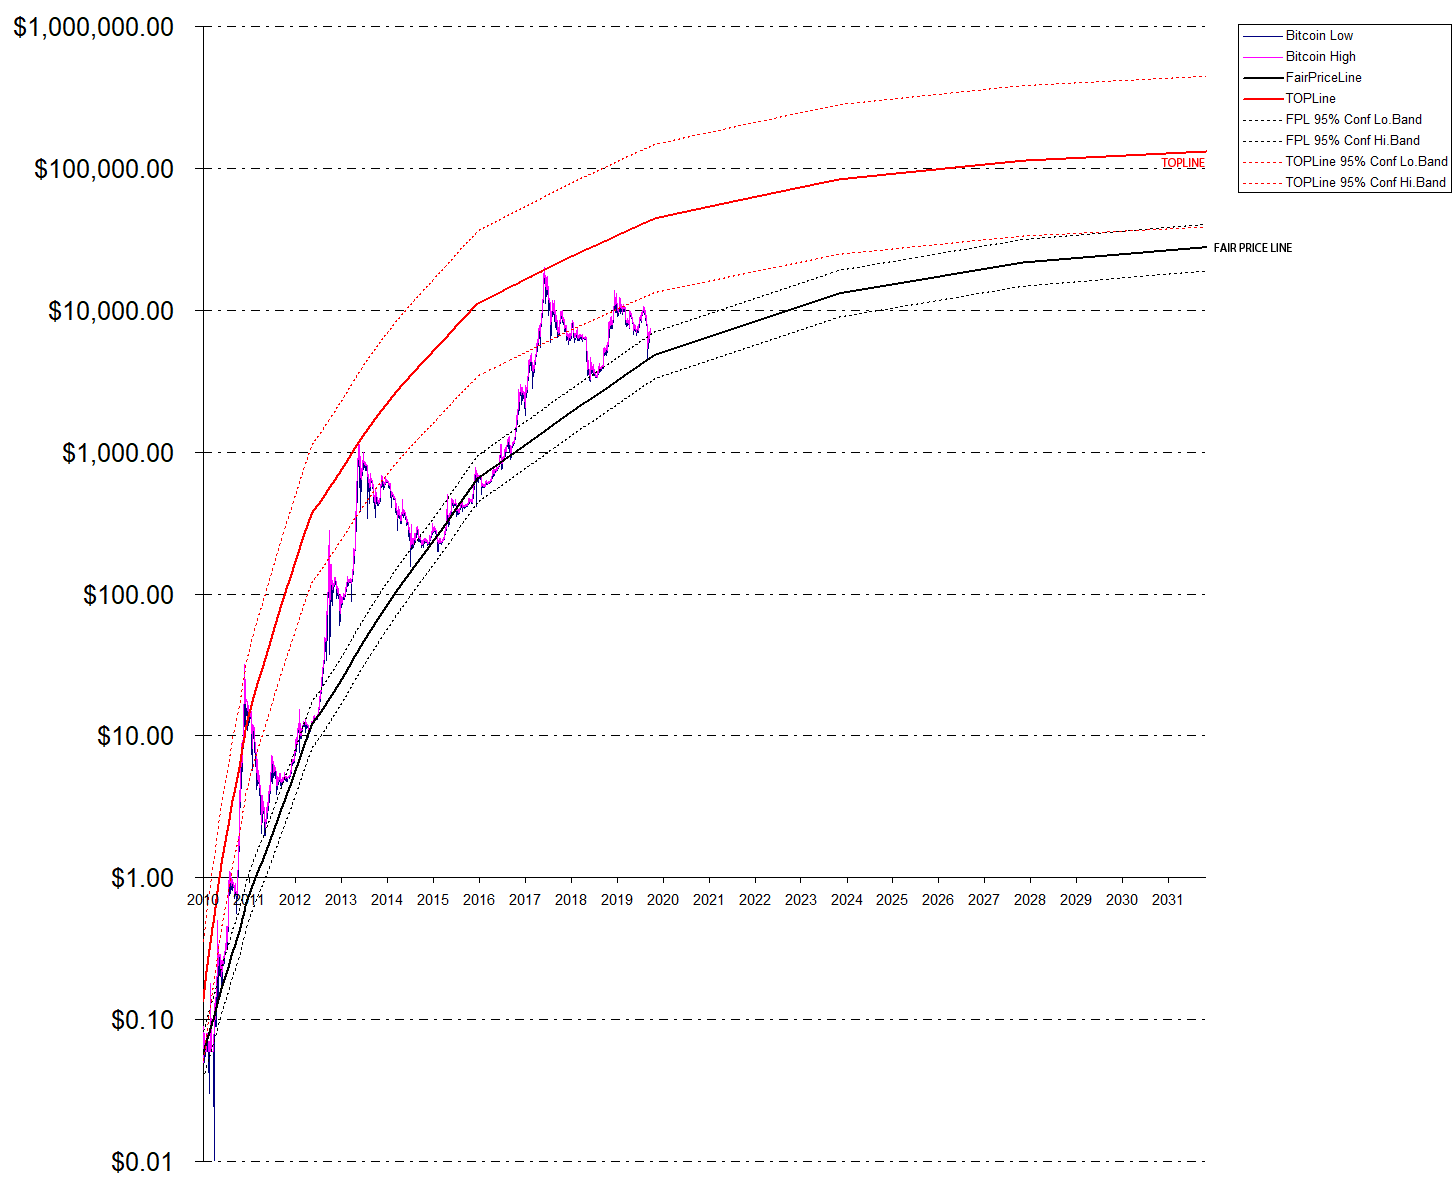
This is a forecast up to 2032 halving, price will saturate between 27,000$ and 130,000$ with a maximum possible peak at 450,000$ in case of a strong bubble.
Conclusions
This model is clearly experimental, we will see in the future how it will behave. It is probably questionable my choice to use the existing bitcoin supply instead of using time as a main input for the model, I’m curious to know your opinion about it. Thank you.