Long Term Update

BTCUSD Monthly Chart KAMA Average 5 periods and deviation lines.

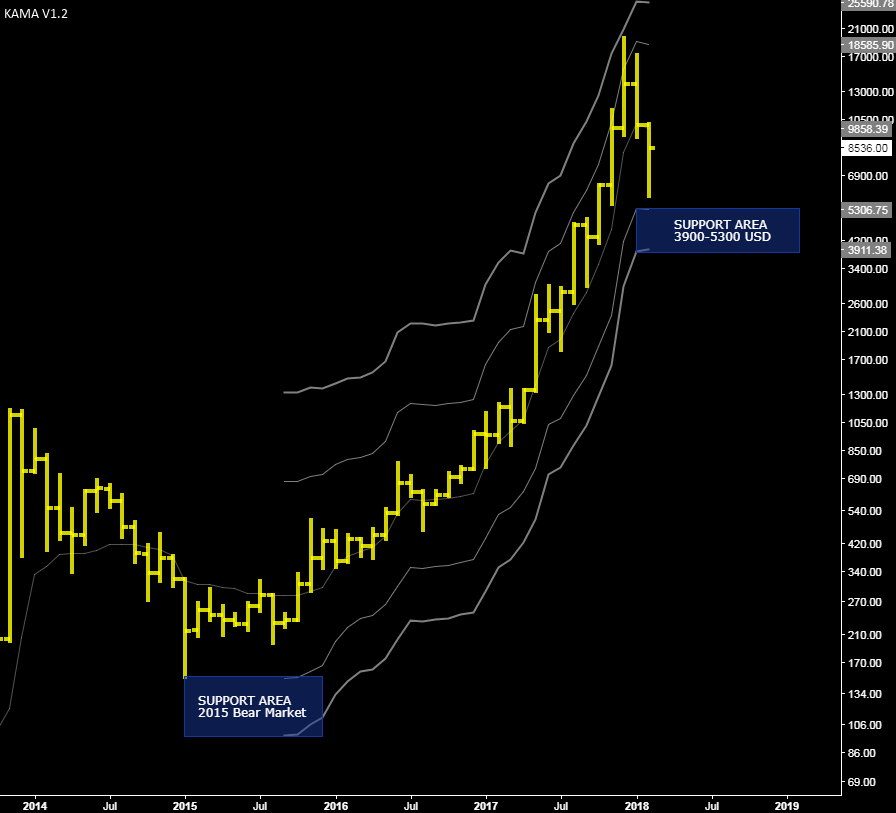
Since the last update on February 13 there are not many new developments. The monthly KAMA average is flat, which allows us to calculate fairly reliable levels of support and resistance. As you can see nothing interesting happened with the BTCUSD cross that remains inside the supports and resistance levels (yellow lines).

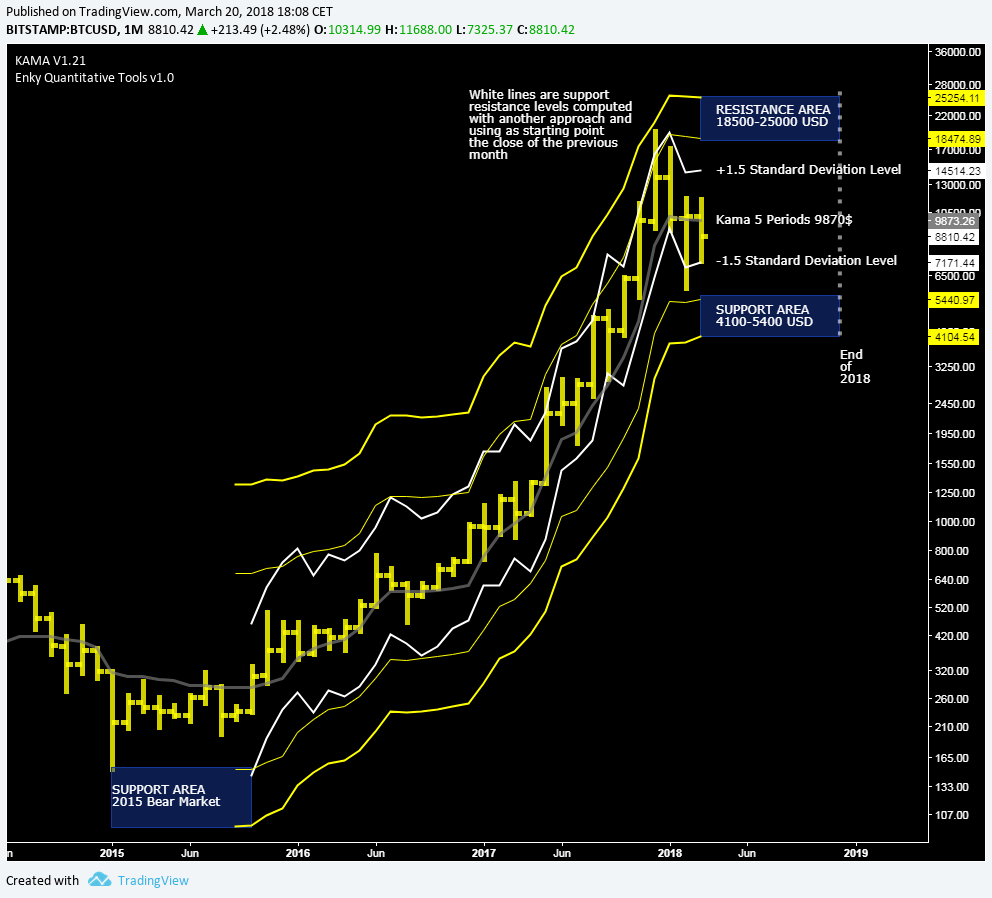
I have added a new indicator that calculates supports and resistances using as a starting point the close of the previous month (with the idea to forecast next month support/resistance levels), in this case the close of February at about $ 10300. I have used the last 50 months, just over 4 years from the bear market’s lowest point in 2015, to calculate volatility.

The drop we have seen in recent days has reached an intermediate level, -1.5 standard deviations, so I can say that there has not been a level of extreme volatility but not even normal.

My opinion is that the bitcoin will continue to remain for most of the year within the levels calculated with the KAMA (yellow) and therefore remains a good opportunity to buy the price area from 4000 to 5500 dollars, while it is to be evaluated a reduction of any bullish position should the BTCUSD go above 25 thousand dollars.

I also give you some short term indications for the next days, the first resistance is $9500, you might see a Top not exceeding $9500 before the BTCUSD resumes its descent. A break above $10000 would mean that at least in the short term the bearish trend is over.


ITA Version here

Long Term Update: Bottom Done Yes or No?

On 18 January 2018, I wrote that the bottom was probably done but I hinted that at the break of the same I would have closed my long term position, unfortunately there was a subsequent very strong selling activity after a weak reaction from the support of the weekly chart (at about 9500$). In these cases it is useful to scale the time frame to the next one (from weekly to monthly), so i applied the KAMA average and its deviation lines to the monthly graph instead of applying them to the weekly graph.
The resulting graph is this at the moment and the market has reacted strongly from this support area.

monthly chart btcusd
BTCUSD Monthly Chart – Kama and deviation lines

You can see that the first deviation  line has hold the price from further lows at the end of the 2014-2015 bearish market, the same negative deviation line reported to date is at about $ 5300 and the market, for now, has done a bottom at $ 5900. I’ts difficult for me to say if the bearish market started in December 2017 is over, I remain convinced that we will hardly see stable prices under $3900 and that the support area from $3900 to $5300 will be very strong for this year.

If during ther year the trend of the Kama average becomes bearish from flat we will have a confirmation that a down trend, even on the monthly chart, has been established and this would undermine a little the validity of the support area indicated in the chart.
For now I think that the market is still stronger than the 2014-2015 period and that any medium-term correction should be above the indicated support area.

Italian version here.