Long Term Update: Bottom Done Yes or No?

On 18 January 2018, I wrote that the bottom was probably done but I hinted that at the break of the same I would have closed my long term position, unfortunately there was a subsequent very strong selling activity after a weak reaction from the support of the weekly chart (at about 9500$). In these cases it is useful to scale the time frame to the next one (from weekly to monthly), so i applied the KAMA average and its deviation lines to the monthly graph instead of applying them to the weekly graph.
The resulting graph is this at the moment and the market has reacted strongly from this support area.

monthly chart btcusd
BTCUSD Monthly Chart – Kama and deviation lines

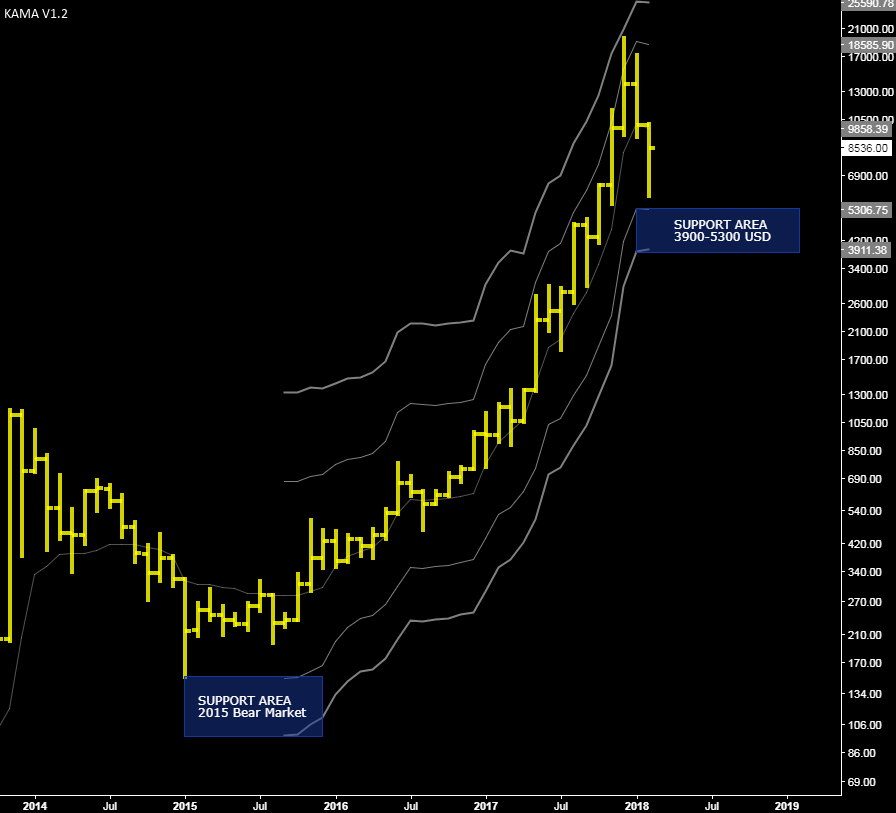
You can see that the first deviation  line has hold the price from further lows at the end of the 2014-2015 bearish market, the same negative deviation line reported to date is at about $ 5300 and the market, for now, has done a bottom at $ 5900. I’ts difficult for me to say if the bearish market started in December 2017 is over, I remain convinced that we will hardly see stable prices under $3900 and that the support area from $3900 to $5300 will be very strong for this year.

If during ther year the trend of the Kama average becomes bearish from flat we will have a confirmation that a down trend, even on the monthly chart, has been established and this would undermine a little the validity of the support area indicated in the chart.
For now I think that the market is still stronger than the 2014-2015 period and that any medium-term correction should be above the indicated support area.

Italian version here.


Weekly Range Update

engXBT / USD weekly price range forecast $760-$800 | Even this week the support/resistance levels remain the same, the main resistance is the second dev. line above the VWAP at $800 while the support is still valid the VWAP at $720 approximately but with these levels of low volatility i think it will be support the first dev.line above the VWAP at $760. This week we’ll see if there will be enough energy to break the $800 and reach the next resistance at $840 by year-end.

The average of the daily RSI oscillator is in overbought territory. The RSI on the weekly chart is slighty overbought just above the threshold of 70, despite being overbought for some continuous weeks i think that a maximum on the weekly chart has not yet been done.

In case of extreme drop the support is the price area between 495 and 590 US.

Italian version here at bitchanger.com

Long Term Update: Weekly Chart

grafico-settimanale-xbtusd
Weekly Chart XBTUSD

In recent weeks the XBTUSD cross has finally accelerated to the upside after an accumulation period lasted two months, now it has reached the first resistance of the bullish price channel based on the weekly chart.

This area of resistance starts at $ 750 and ends at $890. I believe that the next top will fall in this price range, precisely between 750 and 890 US dollars. Because of the long-term trend still up i think that bitcoin could make a maximum higher than the previous one of June, it is not excluded a Top around $ 900 as shown in the weekly chart.

For those unwilling to risk it is not wrong to take profit at these price levels and eventually reopen the position once the $750 resistance level is broken.

Italian version here at Bitchanger.

Long Term Update: Weekly View

eng
XBTUSD Weekly chart with price regression channel

This is a weekly chart since the bottom of March, 2015; the underlying weekly tendency is still up since then.
Inside this long term up channel there are secondary tendencies or cycles clearly visibile and highlighted by the alma moving average.

Last up cycle ended on the top just outside the high volatility zone in June 2016. After 3 months we are still in a secondary  down cycle inside a big up cycle. As i’ve told you in previous updates the maximum extension of this down cycle is at $420 as indicated in the above chart, i doubt we will see weakness below this important level.

At the moment the price is exactly at the middle point of the price regression channel and it’s very hard to say which direction it’ll take, in any case if there will be a new crash down to $420 i’ll further increase my long term position; at the same time if XBTUSD start to stay consistently below $420 i’ve to conclude that the long term up cycle is over and a bear market is ahead.

As i’ve said many times in the past years i don’t believe in a prolonged bear market because bitcoin and its network are healthy and just at the beginning of their life. Key is patience.

Long Term Update

This is a template i use with metatrader 4 where you can see a price regression channel. Yellow line is the same average i use on sierrachart, ALMA moving average.

weekly
Weekly Chart since October 2013

The dotted deviation lines are calculated using the volatility derived from the average true range indicator. The solid deviation lines are calculated with the same approach but using two times the value of the average true range. Most of the time XBTUSD stays inside the dotted deviation lines but during period of high volatility it moves towards the solid deviation lines as happened in the last Top of June at $780.

With the bitfinex flash crash XBTUSD tested the first lower deviation line at $475 although on some exchanges the bottom touched $460. I don’t think is over yet, there might be a secondary reaction that can last all this month and maybe part of September with a test of the lower deviation line, this price level is near $400 as indicated in the chart.

The color of the mid-channel line represents the strength of the trend, red if bearish, white for neutral and green if bullish, at the moment the main trend is bullish and it’ll not change if XBTUSD doesn’t move below $400 for a prolonged period of time. I’m not going to liquidate my position as soon XBTUSD stays inside this long term bullish price channel.

As usual this article is available also at steemit.

Long Term update: Static Resistance

Monthly Chart

monthly

This is a simple monthly chart since Jan.2012, important facts are:

  • Accumulation zone #2 is above previous one, #1 in the chart
  • The static resistance at $680 is also the 50% of the price swing from the all time high down to the 2015 bottom at ~$150

As i explained in past updates the midpoint or 50% it is one of the strongest and most important resistance/support level. The main trend is obviously up (at least so far) because the low around point 2 in the chart is above point 1 thus is legit to expect a new all time high if this market can break above the $680 static resistance.

Furthermore the fact that the two accumulation zones highlighted in the chart never overlap tell us that the underline long term trend is very strong and because of this i expect a new all time high in case of a strong breakout above $680.

Forecasting resistances

btcusd-mn1-simplefx-ltd

This is a template i use for long term analysis with metatrader 4 platform, first i compute a price regression with 12 or 24 bars/months with a monthly chart then i compute supports and resistances. Dotted lines represents supports/resistances using the recent volatility of XBTUSD, non-dotted lines are levels computed using twice the value of recent bitcoin volatility.

We are exactly at the resistance and this is very interesting because in 1-2 months we will see if bitcoin long term trend is still up or not.

I have taken in account the log-normal distribution of price otherwise i’d have had very bad results in computing the levels, usually it is not required but when prices movements are so high you have to. What does it mean? It’s simple, before doing any calculation first compute the natural log of the price, do your stuff and last reexponentiate the data to have back the price chart with a linear scale.
This is why i do not recommend to use standard bollinger bands with bitcoin on a long term chart, you would have bad results, sometimes with the lower bollinger band going negative! clearly unrealistic.