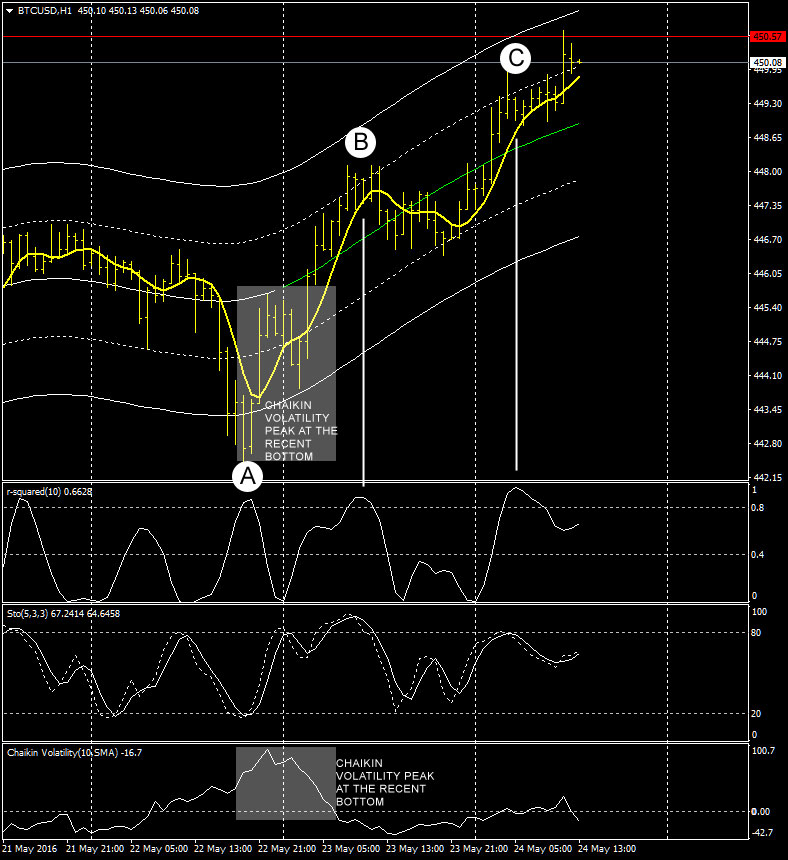
This is bitcoin 1 hour price action chart since May 21, i labeled in the chart 3 points where the R-Squared indicator topped above the 0.8 thresold, i explained in this update how R-Square works. Yellow line is the ALMA moving average while below the price chart we have the r-squared indicator, classic stochastic oscillator and Chaikin Volatility indicator, last two with standard values. It is interesting to notice that on the bottom we have had a volatility peak, oversold stochastic oscillator, r-square above 0.8 and the price touching the lower support of my regression price channel. These are all good signs that may  signal a turnaround in the trend. As i explained in a previous update about r-square when this indicator cross the 0.8 thresold signaling a possible end of the current price swing (up or down) doesn’t necessary mean that the price will reverse and fall, as you can see in point C of the chart, why is this happening? Because if the overall trend is strong all the price corrections in an uptrend sometimes are not strong enough to push the price down therefore we have situations where the price stays flat or reduce its speed without doing a price reversal. At point B in the chart you can see that both r-squared and stochastic oscillator were signalling a reversal but XBTUSD stayed flat or sideway.
Furthermore the Chaikin volatility indicator can give you further information when to trade or not, here it indicated very well an intraday bottom (hopefully it could be also a bottom on the daily chart as i speculated in the previous update) again at point A.
Possible strategies are to buy when there is a retracement after a strong reaction, in this case wait a situation like the one at point A, wait the retracement after point B and buy at the subsequent price reaction to the upside to end your trade at point C where the R-Squared saturated above the 0.8 thresold. In this case we are talking about 2-2.5 usd profit for each btc traded, not much if you consider the high spread and fees charged by bitcoin exchanges, an old reason why i don’t trade intraday this market yet.