Weekly Range Update

bitstampUSD 1 Day #1 2017-09-18 09_48_01.095
XBTUSD Daily Chart – VWAP Levels

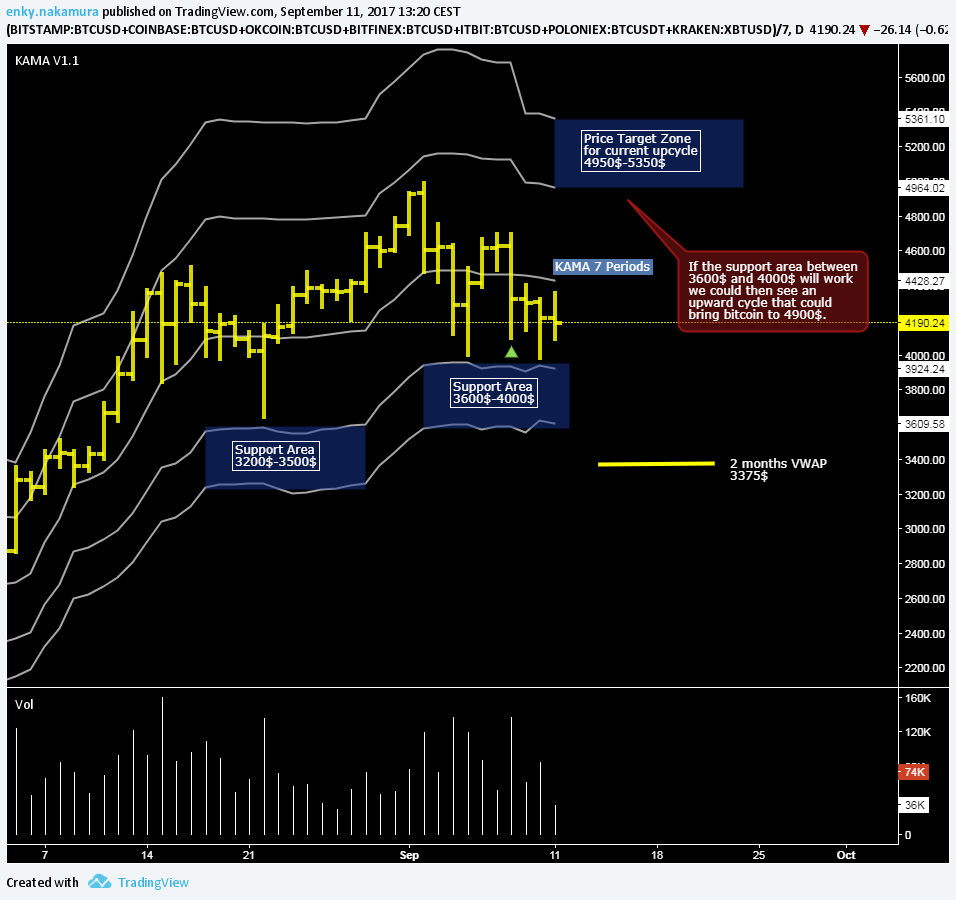
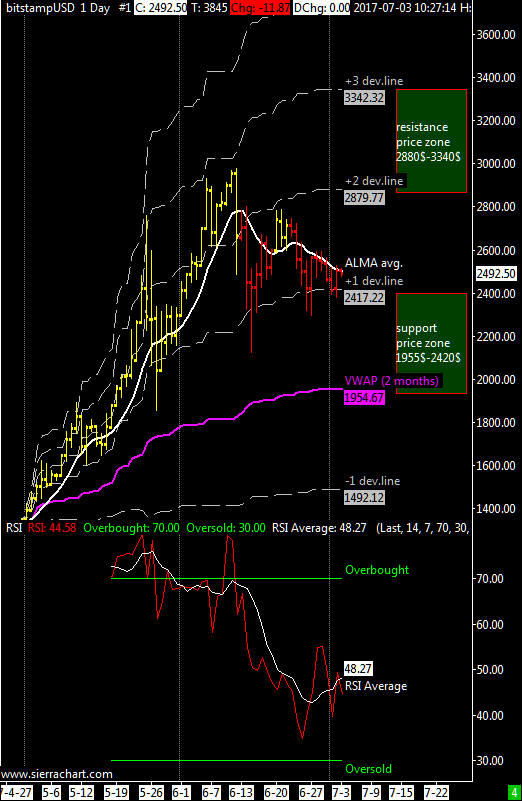
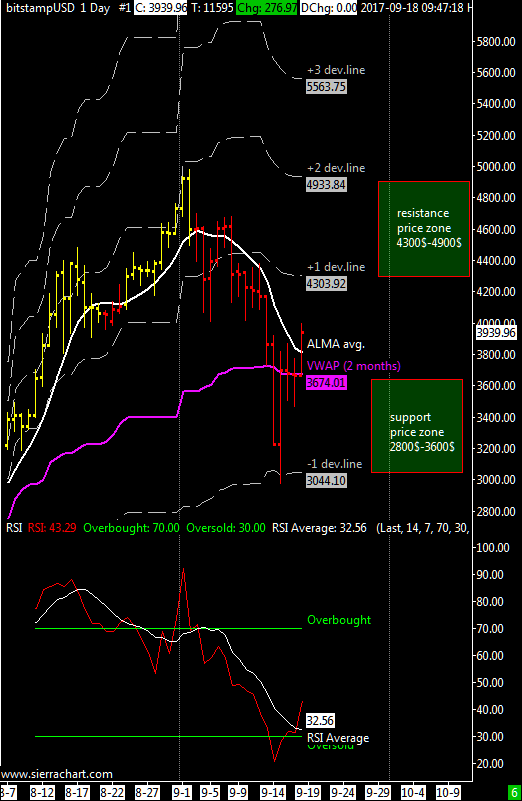
XBT/USD weekly price range at 3650$-4300$ | As I wrote on twitter the market found support within the support area of my previous update that had a lower limit of $2800. I would like to point out that I will not increase my long-term position opened between 2014 and 2015, but I will tell you when there will be a buying opportunity.

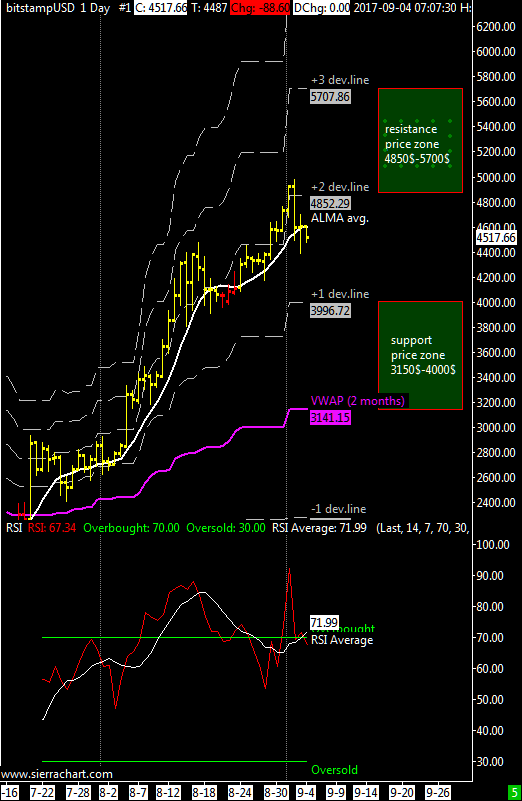
Today’s reaction is positive and I believe that in 1-2 days the ALMA moving average will turn upwards together with the average of the RSI oscillator.

The RSI has already given a purchase signal, but it is better to confirm it when its average slope will also turn positive.
When these conditions are met we will have a buying opportunity.

In the event of a catastrophic news, the support area on the weekly chart remains unchanged at 2000-2500 US Dollars.

ITA version here.

Short Tem Update: KAMA Levels

KAMA Levels
KAMA Levels

XBT/USD weekly price range at 4000$-4950$ | The price range for this week is not very different from last week, we have seen until now a weak September with the price drop from the all time high of 5000$ and despite several negative news the XBTUSD has remained above 4000 dollars.
As you can see in the graph the support area using my KAMA indicator ranges from $3600 to $4000, the resistance zone from $4950 to $5350.
If the 4000$ support will work, then an upward cycle with a minimum target of 4950$ could start, otherwise the 2-month VWAP around 3400$ is an important support.
I think it’s unlikely to see bitcoin under the vwap at 2 months for this and also next week, otherwise it would mean that on the weekly chart a medium-long term correction has started; however it’s still early to say and let see if XBTUSD can stay above $4000 this week.

In case of a unexpected catastrophic news, the support area on the weekly chart is 2000-2500 USD

ITA Version here

Weekly Range Update

XBTUSD dailychart
XBTUSD dailychart

XBT/USD weekly price range at 4000$-4850$ |The XBTUSD cross has seen a correction during the weekend moving back below the second line of price deviation, I see as important support for this week the price level at 4000 dollars, for those who are willing to buy I would suggest to observe the behavior of the XBTUSD cross around that level.
As already mentioned in the previous update, we must not forget that bitcoin remains in a strong position and has been long standing above the VWAP’s first line of deviation and that therefore these corrections are not worrying if limited to 2-3 days.

The average of the RSI oscillator is above the threshold of 70, confirming that the bearish signal of August 26-27 was a false signal as I assumed previously. This indicator is not recently giving clear indications because despite all XBTUSD is maintaining an upward trend without excessive volatility, elements that compromise the proper functioning of any technical oscillator.

In the event of an extreme fall, the support area is 2300-2800 USD

ITA version here.

Weekly Range Update

XBTUSD dailychart
XBTUSD dailychart

XBT / USD weekly price range is 3200$-4800$ | Our beloved cross pair XBTUSD is showing strength and it will probably test for the first time ever the fourth price deviation line of the 2 months VWAP that I normally don’t use, this 4th line defines the upper bound of the resistance zone ranging from 4200 to 4800 dollars.

I think that XBTUSD cross could reach 4800 dollars this week or the next one considering that all the cryptocurrencies sector is going up massively with bitcoin taking the lead and rising with the fastest speed. Market is appreciating the recent efforts to improve bitcoin’s capacity.

The average RSI oscillator has returned above the overbought area and it will probably stay between 70 and 95-100 when bitcoin is so strong, ALMA moving average is bullish since the bottom of  mid July.

In case of extreme fall, the support area is 1900-2400 USD

Weekly Range Update: new top ahead?

XBTUSD dailychart
XBTUSD dailychart

XBT / USD weekly price range estimated at 2400$-3120$ | For this week the range in case of low volatility could be 2600$-2880$, in case of volatility above normal we could see a range of 2400$-3120$ thus implying a new all time high above 2900$.

As you can see in the chart, the price remain bounded between two deviation lines, the first and second; this week the XBTUSD cross should break one of the two levels by retesting the VWAP or making a new all time high between the third and fourth price deviation lines (3120$-3360$).
As i said in some of my earlier updates I still expect a maximum above 2900$ for this year, I still believe that it will happen.

As for the other indicators I use in this template, you can see that the ALMA average is back to bullish and the RSI has quickly tested the oversold area below the threshold of 30 during the 1800$ bottom and now it quickly returned above 50.

In case of extreme fall, the support area is  1250$-1600$.

Follow me also on Twitter where I started to publish graphics on both bitcoin and some of the most important altcoins using the TradingView.com platform
ITA Version here.

Weekly Range Update

XBTUSD dailychart
XBTUSD dailychart

XBT / USD weekly price range is 2400$-2880$ | The XBTUSD cross resists over 2400$ support but as I said last week there is always a risk that it breaks down towards the 2 months VWAP roughly at $1950.

With the ALMA daily moving average pushing bitcoin down and its effort to stay above 2400$ there is some sort of compression also visible in the chart as a symmetric triangle (descending tops and ascending bottoms), as I have said several times in the past  this pattern usually forms during a trend as a continuation pattern thus it should end with an upside breakout.

To conclude, the average RSI oscillator is in neutral zone near 50 and the RSI itself has stopped falling without ever entering the oversold area below 30.

In case of a catastrophic event the support area is 1150$-1450$.

Follow me also on Twitter where I started tweeting charts about bitcoin and some altcoins too using the TradingView.com platform
ITA Version Here

Weekly Range Update

XBTUSD dailychart
XBTUSD dailychart

XBT / USD weekly price range is 1930$ – 2360$ | The 2-month VWAP is slowly rising and is now about  1500$ which is an important support and as long as the price remains above it the underlying trend is be upward.

In the last update I mentioned that when a market is very strong it can move between the first and the second line of price deviation from the VWAP except for rare cases where it can be between the second and the third line; after last week’s sell-off the cross XBTUSD moved back between the first and the second deviation line between 1900 and 2400 dollars as you can see in the chart.

Considering the current level of volatility it is not excluded to see bitcoin again above 2400$ by the end of this week, the support area that i consider is 1930$ and as very solid support there is always the VWAP’s even though I think it is more likely that the intermediate support at approximately 1700$ will hold.

In case of extreme fall, the support area is updated to 980$-1350$.

ITA version here.

Long Term Update: Weekly Price Channel

weekly_chart_xbtusd
Weekly Chart – Price Channel

It seems that a correction has started on the weekly chart although the ALMA average is still bullish and not yet 100% confirming the move; sometimes a return to the mean or average is healthy for an uptrend, here the level is around 825$.

First deviation line is 650$ and the second one 530$. I fail to see an event strong enough to increase the volatility level so much to push this pair down to 530$, i remain confident that it’s not going so low and that the 650-825 usd price zone is a good support for long term buyers.

It is needed a close of this weekly bar above 1030$ to avert the risk of a correction of some weeks. The weekly RSI is above its mid-line or 50; in a strong uptrend the RSI usually stays above it as XBTUSD is doing since october 2015.

Weekly Range Update

eng
XBTUSD daily chart

XBT / USD weekly price range 1200$-1425$ | Also this weekly range has been calculated using twice the volatility level commonly used until the situation will stabilize after the great volatility seen during the Sec decision about the etf.

The average ALMA is about to turn upward and the RSI oscillator backed off from overbought territory but not yet gone into oversold.

I think we need a move to new highs around 1400$, it would be a good signal to confirm the uptrend. About the daily bar of 10-11 March i think that this market cleared weak hands, I am tempted to interpret this as a bullish signal.

In cases of extreme fall the support area is updated to 650-790 US dollars.

ITA version here.

Weekly Range Update: stronger then expected

xbtusd daily chart
xbtusd daily chart

XBT / USD weekly price range is 935$-1095$ |Last week the cross XBTUSD has been stronger than expected so for this week the resistance is raised to 1100$, the support remains the VWAP at 935$.
The ALMA average has turned upward with the break of the resistance at 1015$ while t
he oscillator RSI has given a sell signal last week that has been ignored by the market confirming the strength of the bitcoin-dollar cross. The RSI has however pulled away from the overbought zone but remained above the mid-point of 50, thus remaining in bullish territory.

In short, the market is strong and has ignored my bearish worries of seven days ago; regarding my long-term position opened since 2014 I’ll continue to maintain it until I see some serious bearish indications  on the weekly and monthly chart. I remind everyone that the average carrying price of my position is around 570$ (three units opened at 681$ , 615$ and 417$ ).

In cases of extreme fall the support area is updated to 650-760 US dollars.

ITA version here.

Weekly Range Update

xbtusd daily chart
xbtusd daily chart

XBT / USD weekly price range $885-$1090 | As long as the XBTUSD pair remains above the medium term VWAP I don’t see any risks to the current uptrend to continue. The average ALMA is upwards since twenty days and the price has entered the resistance price zone published in the previous update, because of this I’m skeptic to see a further rise above $ 1090 without a correction considering also that the RSI oscillator has entered overbought territory, honestly I think that the odds of a correction are increased but the minimum should occur over the VWAP, above the $880 mark.

As support the VWAP is again valid and is updated to $885 even though first I consider as an intermediate support the $940 price level.

In cases of extreme fall the support area lies between 600 and 700 US.

Italian version at bitchanger.com

Weekly Update

eng
Daily Chart XBTUSD

XBT / USD weekly price range is unchanged at 865$-965$ | The XBTUSD cross remained above the VWAP and you can see in the attached chart that a price congestion is building up around $ 910; also for this week the main resistance is the price zone between the first and the second VWAP deviation line line between 965 and 1070 usd.
About support the VWAP is still valid and flat since several weeks,  around 865$.

The average daily RSI oscillator is approaching the overbought zone, i’ll observe carefully this market once the oscillator has come into this area (RSI above 70-80).

In cases of extreme fall the support area ranges from 600 to 700 USD.

Italian version here at bitchanger.com