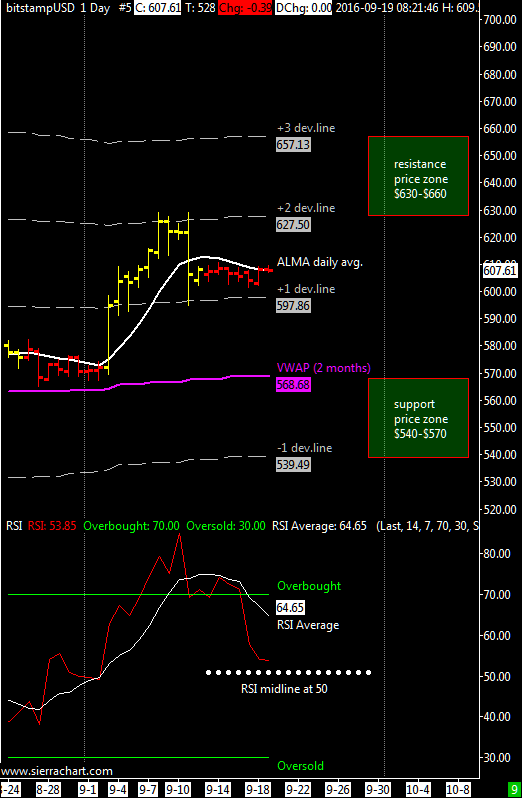
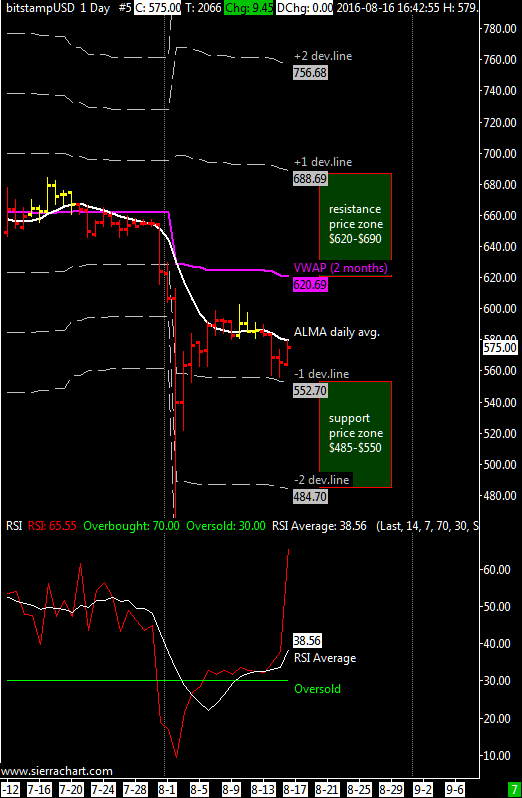
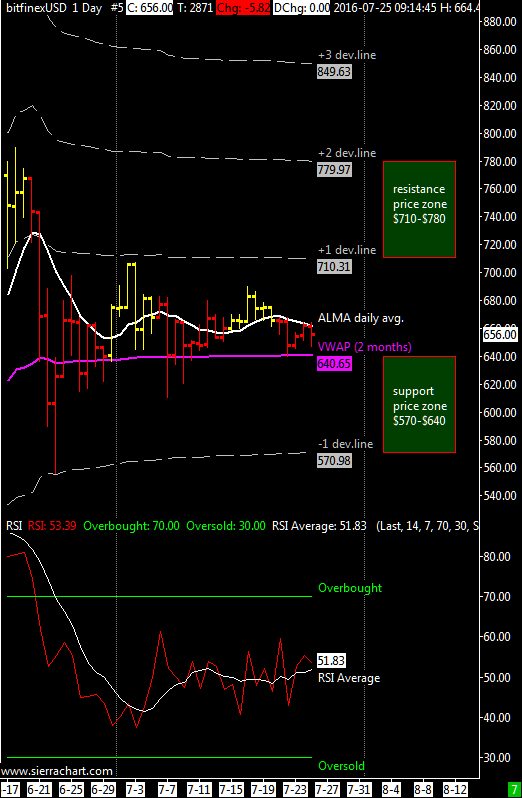
XBT / USD weekly range $570 – $630 | ALMA daily moving average is flat and the main resistance is the second price deviation line above the VWAP @$630 while the support is always the VWAP @$570. For this week i reduced the volatility setting of the sierrachart vwap indicator because the spread between the lines was too high after the bitcoin collapse of August, this adjustment was necessary and now as you can see the new setting better identifies supports and resistances. (For who uses this indicator with Sierrachart trading platform i adjusted the multiplier from 1-2-3-4 to 0,66-1,33-2-2,66)
I think that XBTUSD should remain below $ 630 also this week but a rise above this resistance is close, why? Because the ALMA average on the weekly chart appears to have turned upside and the breakout above $630 would be the confirmation of this reversal. For those wishing to go short I advise to wait at least $ 660 for this week before trying a short sell.
The RSI oscillator has reversed to the downside BUT since we are in a bullish move the RSI threshold of 50 provides support. An important point of the RSI indicator is the midline at 50 because it acts as support or resistance. Around this level there are many fake-outs, sometimes the RSI will fall just below 50 causing sell stops then suddenly the price just rebound. Likewise if crossing above 50, shorts will be covered only to see a resumed downward move. You must pay attention when the RSI is near this midline.
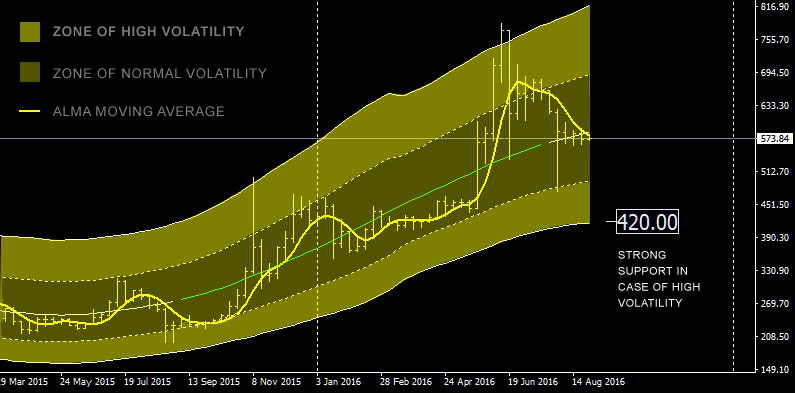
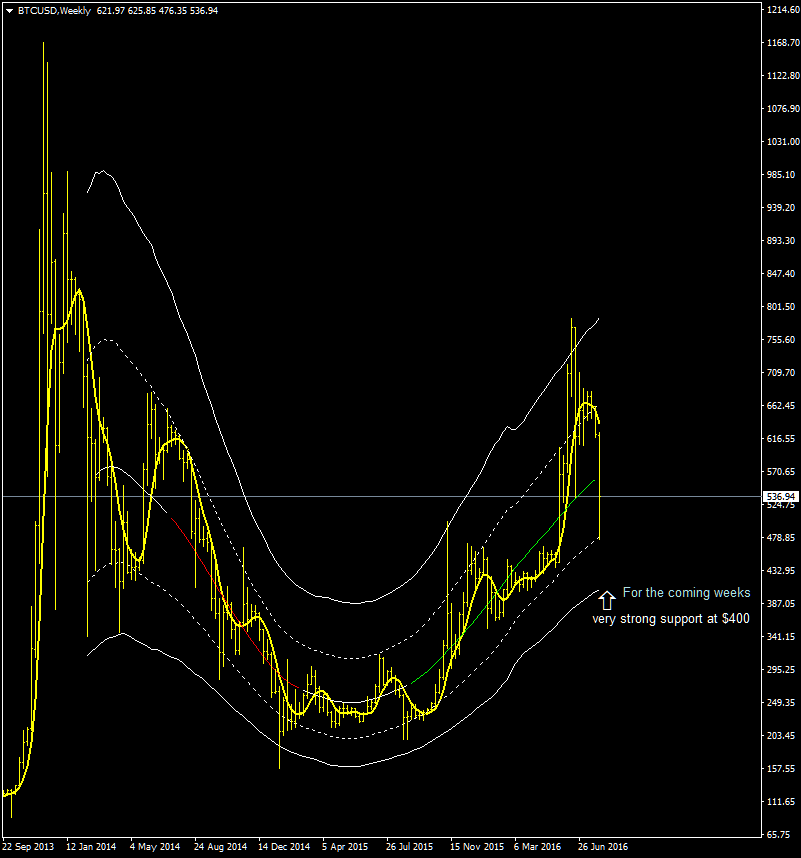
In the event of a sharp fall, as said many times is always very valuable the support around $420.
Italian version here at Bitchanger.com