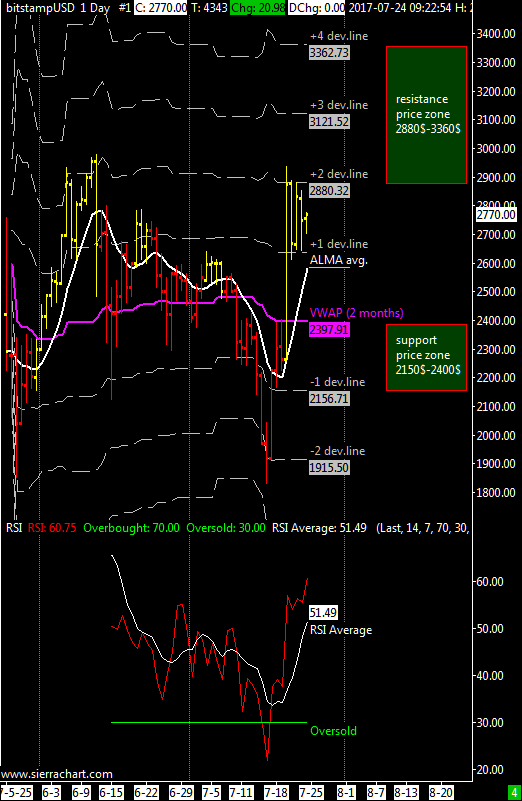
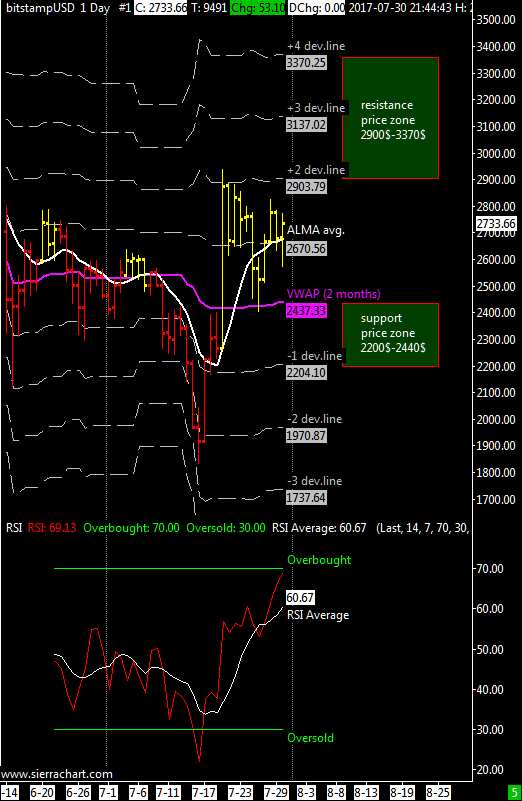
Weekly Range Update: new top ahead?

XBTUSD dailychart
XBTUSD dailychart

XBT / USD weekly price range estimated at 2400$-3120$ | For this week the range in case of low volatility could be 2600$-2880$, in case of volatility above normal we could see a range of 2400$-3120$ thus implying a new all time high above 2900$.

As you can see in the chart, the price remain bounded between two deviation lines, the first and second; this week the XBTUSD cross should break one of the two levels by retesting the VWAP or making a new all time high between the third and fourth price deviation lines (3120$-3360$).
As i said in some of my earlier updates I still expect a maximum above 2900$ for this year, I still believe that it will happen.

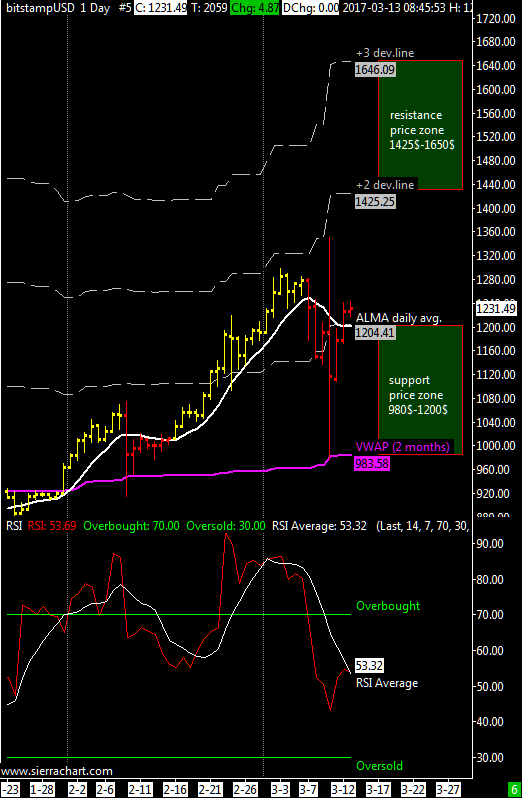
As for the other indicators I use in this template, you can see that the ALMA average is back to bullish and the RSI has quickly tested the oversold area below the threshold of 30 during the 1800$ bottom and now it quickly returned above 50.

In case of extreme fall, the support area is  1250$-1600$.

Follow me also on Twitter where I started to publish graphics on both bitcoin and some of the most important altcoins using the TradingView.com platform
ITA Version here.

Weekly Range Update

XBTUSD dailychart
XBTUSD dailychart

XBT / USD weekly price range is 2400$-2880$ | The XBTUSD cross resists over 2400$ support but as I said last week there is always a risk that it breaks down towards the 2 months VWAP roughly at $1950.

With the ALMA daily moving average pushing bitcoin down and its effort to stay above 2400$ there is some sort of compression also visible in the chart as a symmetric triangle (descending tops and ascending bottoms), as I have said several times in the past  this pattern usually forms during a trend as a continuation pattern thus it should end with an upside breakout.

To conclude, the average RSI oscillator is in neutral zone near 50 and the RSI itself has stopped falling without ever entering the oversold area below 30.

In case of a catastrophic event the support area is 1150$-1450$.

Follow me also on Twitter where I started tweeting charts about bitcoin and some altcoins too using the TradingView.com platform
ITA Version Here

Weekly Range Update: flirting with resistance

bitstampUSD 1 Day #1 2017-06-12 09_28_13.020
XBTUSD daily chart

XBT / USD weekly price range is 2600$-3000$ | Our beloved cross pair XBTUSD slowed its rise last week with a contraction of volatility without being able to stay consistently above 3k USD.
However, we must not forget that bitcoin remains in a very strong position since weeks being above the first positive deviation of VWAP and for more than ten days above the second deviation.
For this reason, I recently added a fourth line of deviation above VWAP that I normally don’t use, this 4th line defines the upper bound of resistance zone ranging from 3000 to 3400 dollars.

I think that XBTUSD cross could reach 3400 dollars this week or the next one considering that all the cryptocurrencies sector is going up massively though bitcoin is the one that is rising at the least speed. I have no sure explanation for this but I could hypothesize that it is because a decent amount of liquidity is flowing into altcoins draining resources from bitcoin.

The average RSI oscillator has returned over the overcrowded area and it is now obvious that in this extreme power situation this oscillator moves from the level defining the overcompatible which is 70 to full saturation around 95-100.

In case of extreme fall, the support area is 1050-1350 USD.

ITA version here.

Weekly Range Update

XBTUSD dailychart
XBTUSD dailychart

XBT / USD weekly price range at 2100$-2900$ | The VWAP is just below 1700$ and the XBTUSD cross is always above it confirming mid-term bullishness.

I have told you many times that when a market is in a very strong position it can move between the first and second price deviation line except for rare cases where it can be between the second and the third line.
From a couple of days back it’s above the second price deviation line and I think that the current rally will continue pushing the bitcoin towards 2900$.

The average of the RSI oscillator is just below the overbought area and I think that bitcoin will ignore this indicator that may remain overbought for a certain period of time due to the fact that the dominant timeframe is the weekly one and as mentioned earlier I think this aspect can push bitcoin over the previous maximum of 2750$.

In case of extreme fall, the support area is 1050-1450 USD.

ITA version here.

Weekly Range Update

XBTUSD dailychart
XBTUSD dailychart

XBT / USD weekly price range is 1930$ – 2360$ | The 2-month VWAP is slowly rising and is now about  1500$ which is an important support and as long as the price remains above it the underlying trend is be upward.

In the last update I mentioned that when a market is very strong it can move between the first and the second line of price deviation from the VWAP except for rare cases where it can be between the second and the third line; after last week’s sell-off the cross XBTUSD moved back between the first and the second deviation line between 1900 and 2400 dollars as you can see in the chart.

Considering the current level of volatility it is not excluded to see bitcoin again above 2400$ by the end of this week, the support area that i consider is 1930$ and as very solid support there is always the VWAP’s even though I think it is more likely that the intermediate support at approximately 1700$ will hold.

In case of extreme fall, the support area is updated to 980$-1350$.

ITA version here.

Technical Update: KAMA, an underrated indicator

Kama moving average is a very interesting filtering technique developed by P.Kaufman.
This moving average has been designed to account for market noise or volatility, KAMA will closely follow prices when swings are small and the noise is low, instead when the price swings widen KAMA will adjust trying to follow prices from a greater distance. This trend-following indicator can be used to identify the overall trend, time turning points and filter price movements when the market is flat avoiding annoying whipsaw false signals trades.

At the moment i’m working on a modified version of this indicator with the help of the tradingview online platform, i added deviation lines from the KAMA average and settings have been optimized to better track XBTUSD price movements on daily and weekly chart.

Here’s an example of this indicator applied to a weekly chart of XBTUSD with some comments.
xbtusd_w

It’s evident that when the market is flat the KAMA average is relatively stable without giving false signals, when this happens you can try to trade deviation lines to catch bottoms or tops.

About this week the secondary positive deviation line is around 3200$, should you go short at that level? Well is at your own risk to trade against the main tendency that now is bullish, instead you might follow the trend buying at the midline or below it, i’m enough sure that today sell-off is healthy and the price was just moving back to the midline point (KAMA average) from the first positive deviation line.

Beware that because of very large price variation during the same bar the KAMA and its deviation lines can change a bit. The indicator is available for free at tradingview.com, just look for “KAMA – Enky v1.0”.

Your feedback is highly appreciated and will help me improving this trading tool.

Short Term Update: 3 days VWAP

eng
3 Days VWAP + deviation lines

After a decisive breakout of the 1480$ weekly resistance level and because of the high volatility i decided to zoom in with an intraday chart (60 min bar). 
Here the VWAP is computed using only the last 3 days and to compute the deviation lines only the volatility of the last 3 days is used, this allow me to have a snapshot of the current situation.
When a market is strong it usually stays above the first deviation line and the second one acts as a resistance, I think that for the rest of the week XBTUSD should stay below 1670$-1750$ with a support area right below the 3 days VWAP (1400$-1500$).
This market is very bullish and it’s quickly accelerating, the volatility i was expecting in my previous update is finally coming to the market.

Long Term Update: Weekly Price Channel

weekly_chart_xbtusd
Weekly Chart – Price Channel

It seems that a correction has started on the weekly chart although the ALMA average is still bullish and not yet 100% confirming the move; sometimes a return to the mean or average is healthy for an uptrend, here the level is around 825$.

First deviation line is 650$ and the second one 530$. I fail to see an event strong enough to increase the volatility level so much to push this pair down to 530$, i remain confident that it’s not going so low and that the 650-825 usd price zone is a good support for long term buyers.

It is needed a close of this weekly bar above 1030$ to avert the risk of a correction of some weeks. The weekly RSI is above its mid-line or 50; in a strong uptrend the RSI usually stays above it as XBTUSD is doing since october 2015.

Weekly Range Update

eng
XBTUSD daily chart

XBT / USD weekly price range 1200$-1425$ | Also this weekly range has been calculated using twice the volatility level commonly used until the situation will stabilize after the great volatility seen during the Sec decision about the etf.

The average ALMA is about to turn upward and the RSI oscillator backed off from overbought territory but not yet gone into oversold.

I think we need a move to new highs around 1400$, it would be a good signal to confirm the uptrend. About the daily bar of 10-11 March i think that this market cleared weak hands, I am tempted to interpret this as a bullish signal.

In cases of extreme fall the support area is updated to 650-790 US dollars.

ITA version here.

Weekly Range Update: waiting the Sec

XBTUSD daily chart - VWAP Lines
XBTUSD daily chart – VWAP Lines

XBT / USD weekly price range 1125$- 1300$ | The range for this week is intended valid until the SEC decision of next 11 March whether to approve or not the first bitcoin ETF; this is an event that can create additional volatility that can push this market well beyond the 1300$ resistance or generate a violent correction down to the VWAP, now at ~950$.

The ALMA moving average remains firmly upward; as you can see in the left attached chart in a strong uptrend hardly the minimum of the day is below this reference average I use.

The RSI oscillator is in overbought zone and essentially confirms that the market is strong but still a top could be in the making. There is also a strong resistance in the weekly chart around 1370$-1400$.

In cases of extreme fall the support area is updated to 610-740 USD.

ITA version here at bitchanger.com

Weekly Range Update: stronger then expected

xbtusd daily chart
xbtusd daily chart

XBT / USD weekly price range is 935$-1095$ |Last week the cross XBTUSD has been stronger than expected so for this week the resistance is raised to 1100$, the support remains the VWAP at 935$.
The ALMA average has turned upward with the break of the resistance at 1015$ while t
he oscillator RSI has given a sell signal last week that has been ignored by the market confirming the strength of the bitcoin-dollar cross. The RSI has however pulled away from the overbought zone but remained above the mid-point of 50, thus remaining in bullish territory.

In short, the market is strong and has ignored my bearish worries of seven days ago; regarding my long-term position opened since 2014 I’ll continue to maintain it until I see some serious bearish indications  on the weekly and monthly chart. I remind everyone that the average carrying price of my position is around 570$ (three units opened at 681$ , 615$ and 417$ ).

In cases of extreme fall the support area is updated to 650-760 US dollars.

ITA version here.

Weekly Range Update

xbtusd daily chart
xbtusd daily chart

XBT / USD weekly price range $885-$1090 | As long as the XBTUSD pair remains above the medium term VWAP I don’t see any risks to the current uptrend to continue. The average ALMA is upwards since twenty days and the price has entered the resistance price zone published in the previous update, because of this I’m skeptic to see a further rise above $ 1090 without a correction considering also that the RSI oscillator has entered overbought territory, honestly I think that the odds of a correction are increased but the minimum should occur over the VWAP, above the $880 mark.

As support the VWAP is again valid and is updated to $885 even though first I consider as an intermediate support the $940 price level.

In cases of extreme fall the support area lies between 600 and 700 US.

Italian version at bitchanger.com