Weekly Top Estimate

Weekly Top Forecast
Weekly Top Forecast

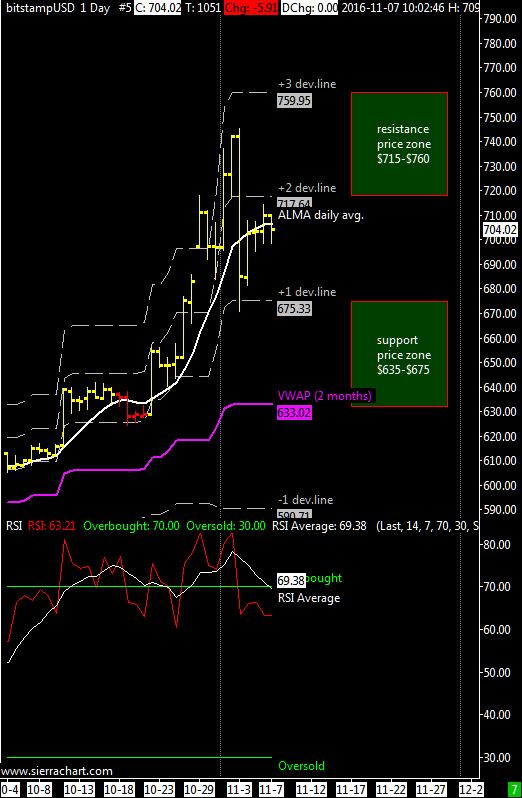
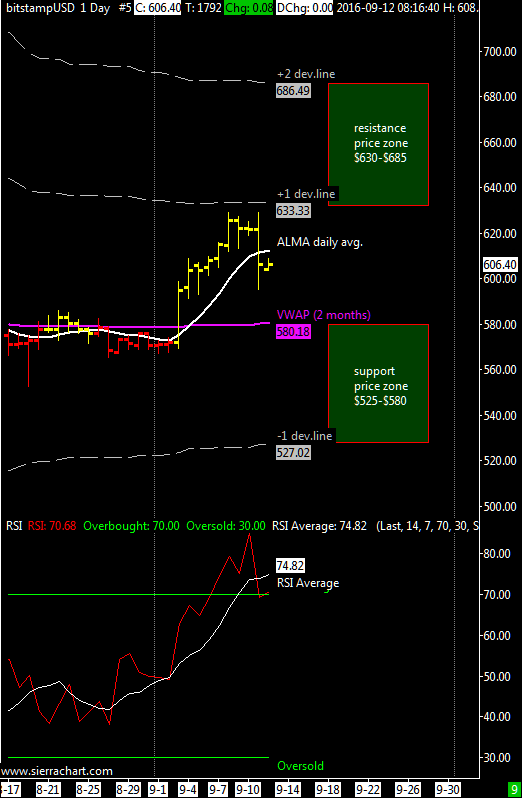
XBTUSD cross has finally break through the first resistance above the mid-line of the price channel now at $640, same price level of the 2 month VWAP. In the attached chart I highlighted the price zone where I expect the next top will fall.

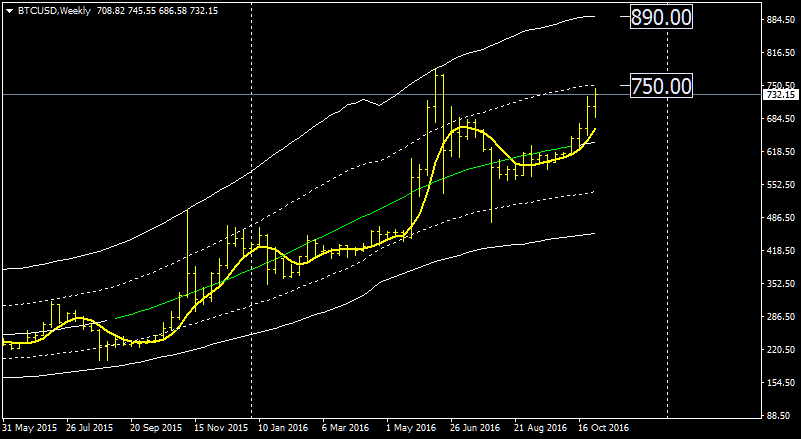
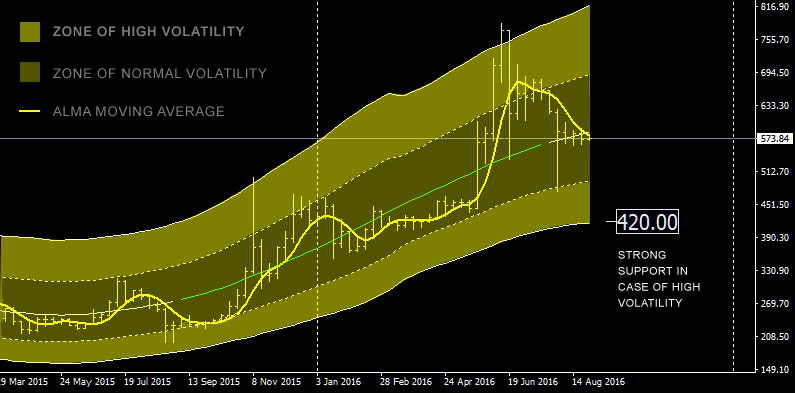
I believe that the next top will fall in this price zone, precisely between 770 and 910 US dollars; because of the long-term trend still up i think that bitcoin could make a maximum higher than the previous one of June, it is not excluded a Top around $ 900 as shown in the weekly chart.

What if i’m Wrong

It exists the possibility that i’m wrong if the dominant timeframe isn’t the weekly.
So what? Well we can switch to another timeframe for example the monthly chart. Here the price channel is much wider then the weekly chart, midpoint is at around $500 usd and the two positive deviation lines are at 870 and 1500 usd. Again we have a resistance similar to the weekly chart, around 870-900.

In order to prove that my weekly scenaro is wrong XBTUSD have to break above 900 usd with strong volume, as you know a High-Volume Breakout signal a move higher possibly to $1000 and beyond.

Weekly Range Update

eng
Daily Chart XBTUSD

XBT / USD weekly price range is $ 675-$760 | daily ALMA moving average is firmly upward since 26 September, the main resistance is always the third positive price deviation line above the VWAP at $760, i consider the first  positive price deviation line as support for this week at$ 675, our VWAP average is at $ 635.

The strong rise of the last four weeks is the consequence of the weekly cycle turned up in August. Now it remains to be seen if the market will be able to break through the $ 750 resistance with a move to the maximum target illustrated in my previouos update (the 870$-900$ price zone), it’s obvious that if XBTUSD goes under $ 675 with a possible minimum at the VWAP (~635 usd) then I believe that the Top at around 750$ is confirmed and we will see a correction in the weekly chart down to a new low, a low that will be probably above 450$ because the long term trend is still up.

The average daily RSI oscillator is in overbought zone and I think we can still ignore the information of this oscillator because the dominant timeframe is now the weekly one. The RSI on the weekly chart is not yet overbought but close to the 70 threshold.

In the event of a sharp fall the support is in the area $ 450-460.

Italian version here at bitchanger.com

Long Term Update: Weekly Chart

grafico-settimanale-xbtusd
Weekly Chart XBTUSD

In recent weeks the XBTUSD cross has finally accelerated to the upside after an accumulation period lasted two months, now it has reached the first resistance of the bullish price channel based on the weekly chart.

This area of resistance starts at $ 750 and ends at $890. I believe that the next top will fall in this price range, precisely between 750 and 890 US dollars. Because of the long-term trend still up i think that bitcoin could make a maximum higher than the previous one of June, it is not excluded a Top around $ 900 as shown in the weekly chart.

For those unwilling to risk it is not wrong to take profit at these price levels and eventually reopen the position once the $750 resistance level is broken.

Italian version here at Bitchanger.

Weekly Range Update

eng
Daily Chart XBTUSD @bitstamp

XBT / USD weekly price range 625$-680$ | daily ALMA moving average is firmly upward with a good slope, this week the main resistance is again on the third price deviation line above the VWAP at 680$ while about the support I decided to consider the first positive price deviation line of the VWAP now @625$ , this support has been already tested on October 19 at the slight correction that happened that day, a correction that i was expecting last week in my update of October 17. After this correction i was expecting a resume of the uptrend up to $660, an upmove that promptly happened.
The bullish activity of the last two weeks has been the consequence of the weekly cycle that has turned upwards between the end of August and the first part of September.

The average RSI oscillator is in overbought zone and I think that bitcoin will ignore this indicator for a while and will remain overbought for a certain period of time because of the fact that the dominant timeframe is the weekly one. The maximum extension of this weekly cycle should be around $870 for the next weeks.

In the event of a sharp fall, as i said many times is always the very valuable support area around $440.

Italian version here at bitchanger.com

Weekly Range Update

eng
Daily Chart XBTUSD @bitstamp

XBT / USD weekly price range $590-$660 | daily ALMA moving average is firmly up, the main resistance it’s now the price zone from the second to the third price deviation line  above the VWAP ($635-$660) while the support is always the VWAP at $590.

The situation has finally resolved in an upmove from $610-$615 to $635-$640 because as I said several times the ALMA average on the weekly chart is bullish and pushing up. The daily RSI oscillator average is in overbought zone and I think the bitcoin might do a correction perhaps to $ 610-615 before resuming the uptrend.

In the event of a sharp fall is always very valuable the support around $435.

Italian version here at bitchanger.com

Weekly Range Update

eng
Daily Chart XBTUSD @bitstamp

XBT / USD weekly price range $600-$635 | daily ALMA moving average is still up although its pace is slow, the main resistance remains the second price deviation line  above the VWAP at $ 635 while the support is always the VWAP at $ 565, the situation is not changing much from week to week with this slow buildup between 600 and 615 dollars.

I think is still valid the possibility that this accumulation will resolve with a move above 635 dollars because the ALMA average on the weekly chart has turned upward but again with not much speed. For those wishing to go short I recommend to wait at least $ 675 before trying and however i don’t recommend to do it if bitcoin reaches $ 670-675 in less than 24 hours.

The average RSI oscillator is approaching overbought area and this is a factor that worries me a bit because it could put an end to this slow rise that has lasted since September 22 when it did a small minimum at $593.

In the event of a sharp fall, as said many times is always very valuable the support around $420, now at $430 because the weekly tendency is still up and the support grow with time.

Italian version here at Bitchanger.com

Weekly Range Update

eng
Daily Chart XBTUSD @bitstamp

XBT / USD weekly range $598 – $634 | ALMA daily moving average is bullish and the main resistance is the second price deviation line above the VWAP @$630 while the support is always the VWAP @$570 although i think it will remain above 595$ also this week.

A rise above $630 is close for the same reason i told you severa times in the past weeks, XBTUSD is slowly accumulating and the weekly ALMA moving average already turned up but its slope is very low for now, in the upcoming weeks there should be a final breakout above $630.

The RSI oscillator has moved to an equilibrium point around 50 and there is enough room for more upside movement till the overbought zone.

In the event of a sharp fall, as said many times is always very valuable the support around $420.

Italian version here at Bitchanger.com

Weekly Range Update

eng
Daily Chart XBTUSD

XBT / USD weekly range $595 – $630 | ALMA daily moving average is flat and the main resistance is the second price deviation line above the VWAP @$630 while the support is always the VWAP @$560, similar price range of the last week.

I think that XBTUSD should remain below $ 630 also this week but a rise above this resistance is close for the same reason i told you in the previous update, the weekly ALMA moving average is slowly turning upward. For those wishing to go short I advise to wait at least $ 660 for this week, more probably next week, before trying a short sell. In any case  i do not recommend to go short for prolonged period of times because the underlying trend is still up.

The RSI oscillator has moved to oversold territory and failed to stay above the threshold of 50 that usually provides support. The average of the oscillator apparently is doing a bottom with the RSI itself that already crossed the thresold of 30 giving a bullish signal.

In the event of a sharp fall, as said many times is always very valuable the support around $420.

Italian version here at Bitchanger.com

Weekly Range Update

engXBT / USD weekly range $570 – $630 | ALMA daily moving average is flat and the main resistance is the second price deviation line above the VWAP @$630 while the support is always the VWAP @$570. For this week i reduced the volatility setting of the sierrachart vwap indicator because the spread between the lines was too high after the bitcoin collapse of August, this adjustment was necessary and now as you can see the new setting better identifies supports and resistances. (For who uses this indicator with Sierrachart trading platform i adjusted the multiplier from 1-2-3-4 to 0,66-1,33-2-2,66)

I think that XBTUSD should remain below $ 630 also this week but a rise above this resistance is close, why? Because the ALMA average on the weekly chart appears to have turned upside and the breakout above $630 would be the confirmation of this reversal. For those wishing to go short I advise to wait at least $ 660 for this week before trying a short sell.

The RSI oscillator has reversed to the downside BUT since we are in a bullish move the RSI threshold of 50 provides support. An important point of the RSI indicator is the midline at 50 because it acts as support or resistance. Around this level there are many fake-outs, sometimes the RSI will fall just below 50 causing sell stops then suddenly the price just rebound. Likewise if crossing above 50, shorts will be covered only to see a resumed downward move. You must pay attention when the RSI is near this midline.

In the event of a sharp fall, as said many times is always very valuable the support around $420.

Italian version here at Bitchanger.com

Weekly Range Update

eng
Daily Chart XBTUSD @Bitstamp

XBT/USD weekly range $ 580-$ 630 | ALMA daily moving average is going flat after many days of good advance and the main resistance is now the first positive deviation line of the VWAP at around $ 630.

I think the cross XBTUSD will remain below $ 630 this week with a second resistance at about $ 680. The weekly ALMA moving average is apparently turning up but i don’t expect a break above $630 because also of an high reading of the RSI oscillator that is in overbought territory above the 70 threshold value..

I said in many previous updates that in case of a volatility spike due to another price crash the deal is to buy slightly above $420.

Italian version here at bitchanger.com

Long Term Update: Weekly View

eng
XBTUSD Weekly chart with price regression channel

This is a weekly chart since the bottom of March, 2015; the underlying weekly tendency is still up since then.
Inside this long term up channel there are secondary tendencies or cycles clearly visibile and highlighted by the alma moving average.

Last up cycle ended on the top just outside the high volatility zone in June 2016. After 3 months we are still in a secondary  down cycle inside a big up cycle. As i’ve told you in previous updates the maximum extension of this down cycle is at $420 as indicated in the above chart, i doubt we will see weakness below this important level.

At the moment the price is exactly at the middle point of the price regression channel and it’s very hard to say which direction it’ll take, in any case if there will be a new crash down to $420 i’ll further increase my long term position; at the same time if XBTUSD start to stay consistently below $420 i’ve to conclude that the long term up cycle is over and a bear market is ahead.

As i’ve said many times in the past years i don’t believe in a prolonged bear market because bitcoin and its network are healthy and just at the beginning of their life. Key is patience.

Weekly Range Update


eng
Daily Chart @bitstamp

XBT/USD weekly range $ 550-$ 615 | ALMA daily moving average is still slightly bearish and the main resistance is unchanged at VWAP around $ 615.

I think the cross XBTUSD will remain below $ 615 this week with a second resistance at about $ 680. The weekly forecast is slighlt bearish but i don’t expect a break below $550 because of low volatility.

In case of a volatility spike due to another price crash the deal is to buy slightly above $420.