Short Term Update

imageThe updated chart shows how the VWAP dynamic support (calculated with two months of data) coincides with an old resistance now turned support. I think this will be a key support to be observed in the coming days and will tell us if the bullish move has finished or not.

Because of high volatility the support area is big and XBTUSD is right in the middle, RSI is giving a sell signal this doesn’t mean a drop instead XBTUSD might go lateral for few weeks before resuming the uptrend. Any weakness below $580 would be interpreted as a definitive end of the current big upswing.

Italian version here at bitchanger.

Weekly Range Update

2201XBT/USD weekly range.forecast $725-$870 | daily moving average is bulllish and main support is at VWAP near $580. XBTUSD continues to stay all the time above the first positive deviation line of the VWAP, a bullish behaviour.

In case of a strong price correction i’m looking at the $580 support as an interesting buying zone where to further increase my long-term position; position with a size of 3 units (150 btc) at an average price of $549.

Italian version of this update here at Bitchanger.

Mid-Week Range Update

XBTUSD Daily Chart @bitfinex

XBT/USD range till sunday $650-$770 | daily moving average is bulllish and main support is at VWAP near $540 but as i said earlier this week when the market is strong usually the first positive deviation line is very good as support, now at $650.

The odds now are for a retracement, i suggest to observe market behaviour around the alma moving average and first vwap dev.line both at around 650 dollars.

Intraday Update

This is bitcoin 1 hour price action chart since May 21, i labeled in the chart 3 points where the R-Squared indicator topped above the 0.8 thresold, i explained in this update how R-Square works. Yellow line is the ALMA moving average while below the price chart we have the r-squared indicator, classic stochastic oscillator and Chaikin Volatility indicator, last two with standard values. It is interesting to notice that on the bottom we have had a volatility peak, oversold stochastic oscillator, r-square above 0.8 and the price touching the lower support of my regression price channel. These are all good signs that may btcusd-h1-simplefx-ltdsignal a turnaround in the trend. As i explained in a previous update about r-square when this indicator cross the 0.8 thresold signaling a possible end of the current price swing (up or down) doesn’t necessary mean that the price will reverse and fall, as you can see in point C of the chart, why is this happening? Because if the overall trend is strong all the price corrections in an uptrend sometimes are not strong enough to push the price down therefore we have situations where the price stays flat or reduce its speed without doing a price reversal. At point B in the chart you can see that both r-squared and stochastic oscillator were signalling a reversal but XBTUSD stayed flat or sideway.

Furthermore the Chaikin volatility indicator can give you further information when to trade or not, here it indicated very well an intraday bottom (hopefully it could be also a bottom on the daily chart as i speculated in the previous update) again at point A.

Possible strategies are to buy when there is a retracement after a strong reaction, in this case wait a situation like the one at point A, wait the retracement after point B and buy at the subsequent price reaction to the upside to end your trade at point C where the R-Squared saturated above the 0.8 thresold. In this case we are talking about 2-2.5 usd profit for each btc traded, not much if you consider the high spread and fees charged by bitcoin exchanges, an old reason why i don’t trade intraday this market yet.


Weekly Range Update

XBT/USD weekly range.forecast unchanged at $435-$460 | daily moving average is flat. Strong support is at VWAP near $435. Volatility is low and should increase soon and in case of another upmove strong resistance is at $485 but at the moment this market is having difficulties to pass my previous level at $460.

XBTUSD
Daily Chart XBTUSD @bitfinex exchange
For all the italians that follow this blog i kindly remind you that since few week i’m writing at an italian website about bitcoin news and market coverage, bitchanger.com This doesn’t mean i’m going to drop this blog updates here will continue as usual.

Short Term Update: VWAP test

image
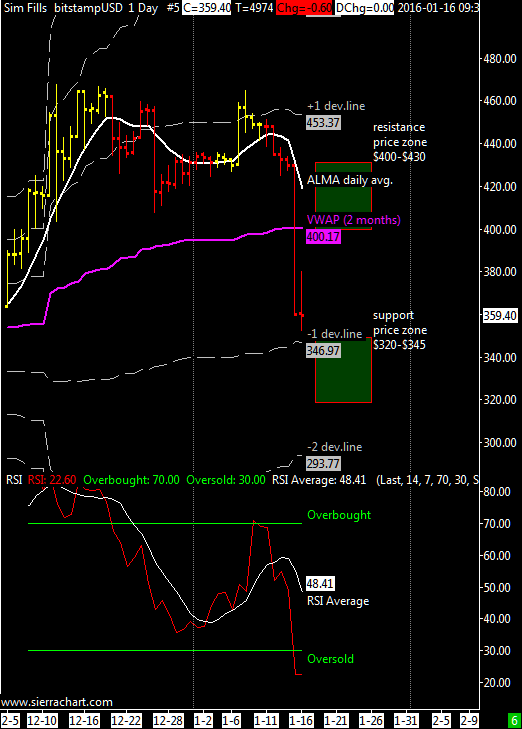
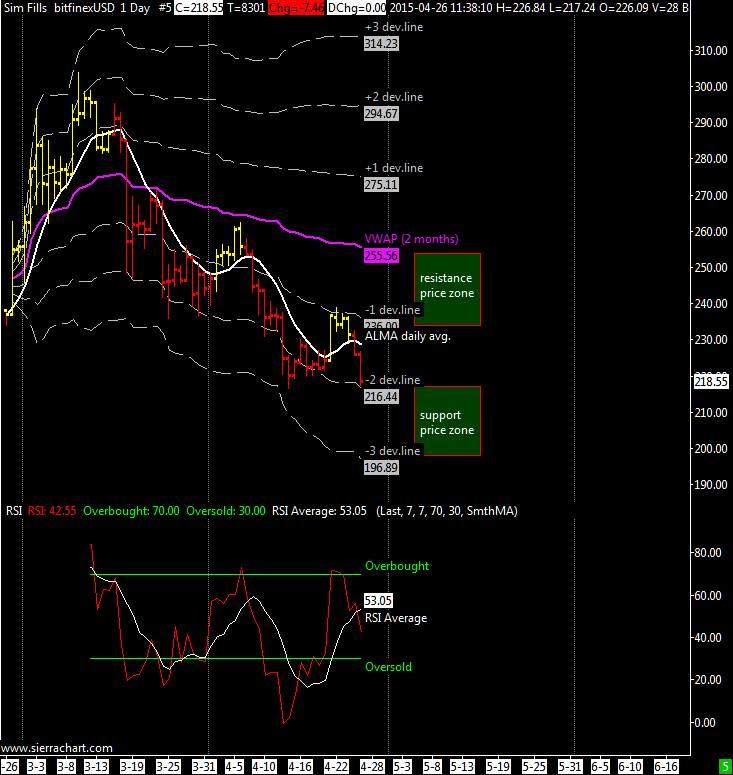
A major drop pulled XBTUSD right above my 2 months VWAP thus for now we are not going to see a stronger up move near $500. However the market might rebounce from here as happened many times in the past after a strong correction the VWAP provided support. I think that could be smart to buy at or slightly below the VWAP between $400 and $425.

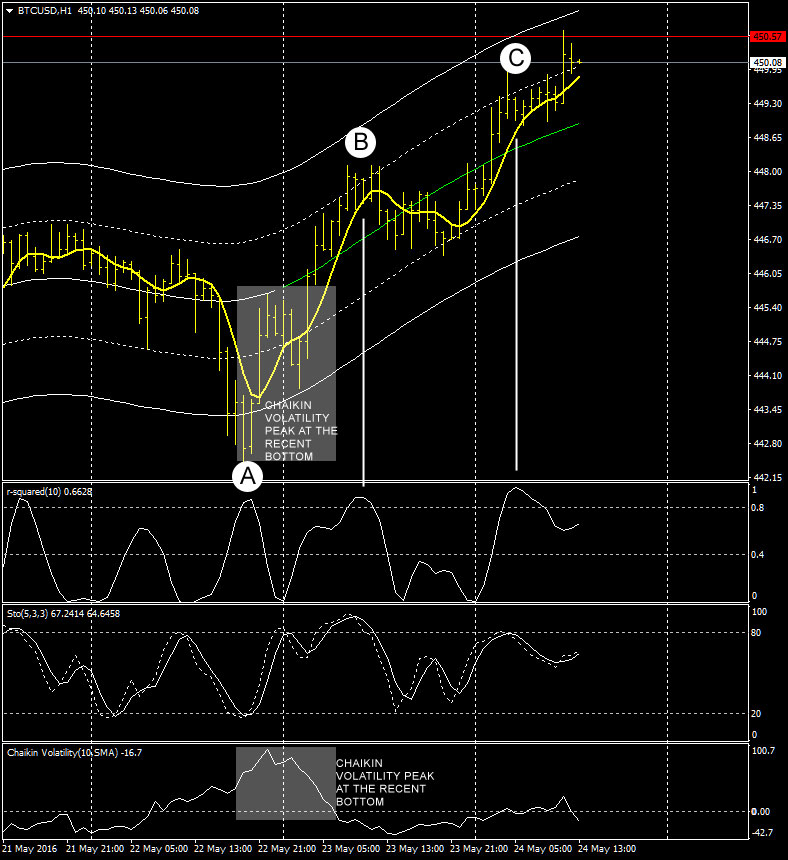
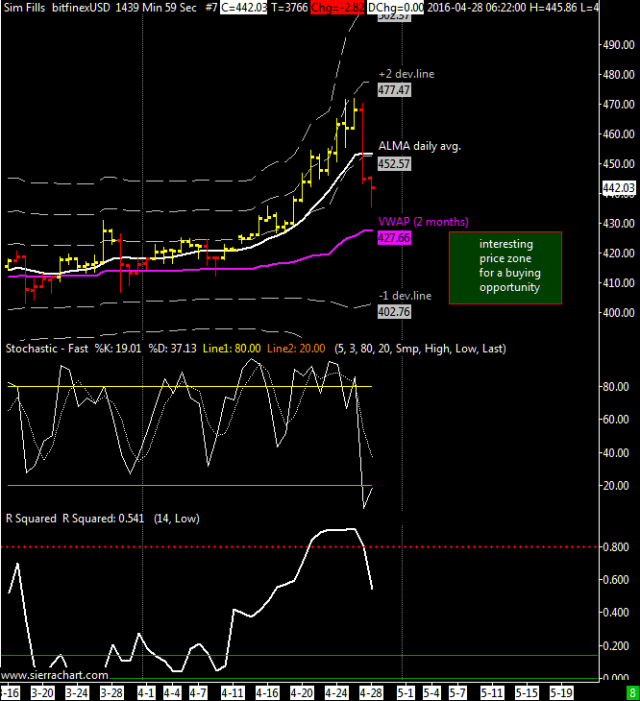
In the attached chart i replaced the RSI with a Stochastic oscillator with standard settings, moreover i added the R-Squared indicator that often is useful to understand what is going on.

R-Squared

What the hell is RSquared?:) Well R-squared is a measure of association and it measures the proportion of explained variation between the linear regression and the underlying data it is tracking. For a trader this means that the r-squared calculation identifies how much closely the linear regression indicator matches the price movement. The higher the r-squared value the greater the correlation with the trending component of price.

The length of lookback parameter (14 periods in the above chart) chosen plays a role in determining the numeric level at which r-squared assumes a positive correlation with the underlying linear regression and price movement at the statistical 95% confidence level; the shorter the r-squared length, the higher the r-squared level needed. In our case a 14 period reaches a positive correlation at the 0.27 level, while a 50-period only needs to exceed a 0.08 level.

R-squared moves on a scale from zero to one. A rising r-squared indicates strength of association with a price that is trending, while declining r-squared readings suggest a weak or weakening correlation between linear regression and price, in this case the price is simply moving sideways without the presence of a trend.

In the above chart you can see that when r-squared is stalling above 0.80 a possible top is near but this doesn’t mean the price is going to crash because another option is the price moving sideways right below a top.

A stochastic oscillator is useful as a timing tool to enter short or long when the r-squared is saturating above 0.80.

Another view of stochastic and r-squared with an intraday chart

BTCUSDH4
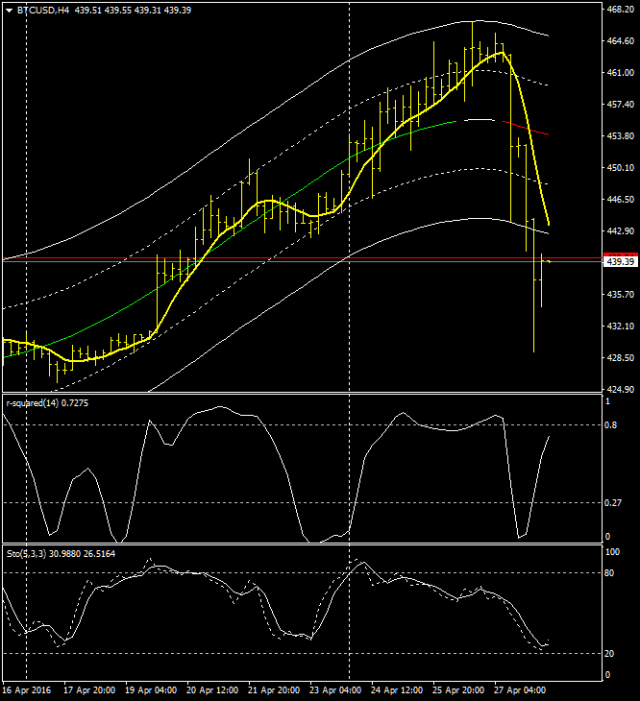
This is an H4 chart of XBTUSD, you can clearly see the cycles of the r-squared moving above 0.27 (0.27 because i’m using 14 periods for the indicator) and 0.80. It is clearly visibile the price going sideways when the r-squared is stalling above 0.80; now the r-squared is again approaching 0.80 signalling that the strong downspike is probably near the end togheter with the stochastic oscillator near oversold territory.
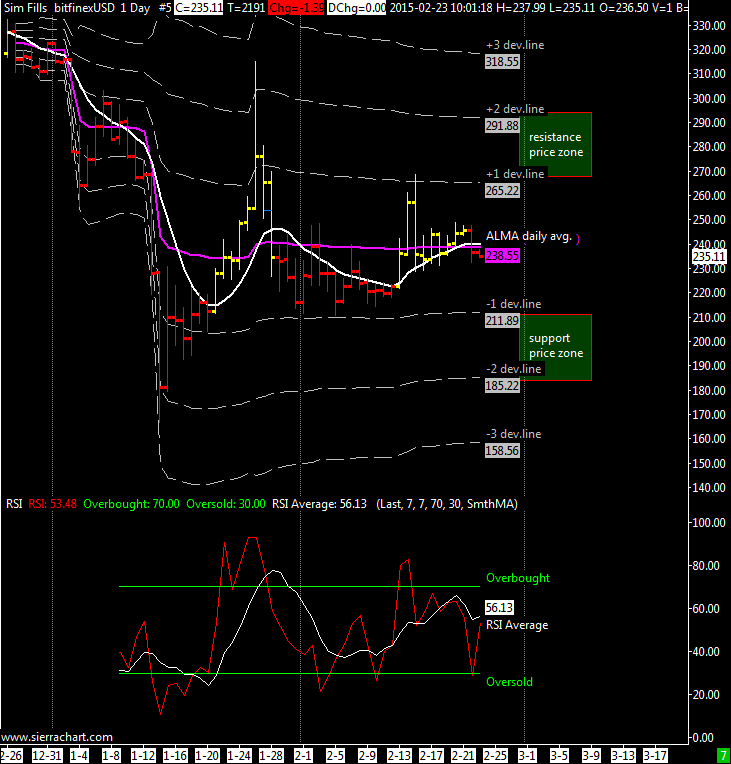
The yellow line is the ALMA moving average, other lines are a way to do a regression of the price and deviation lines to build a price channel.
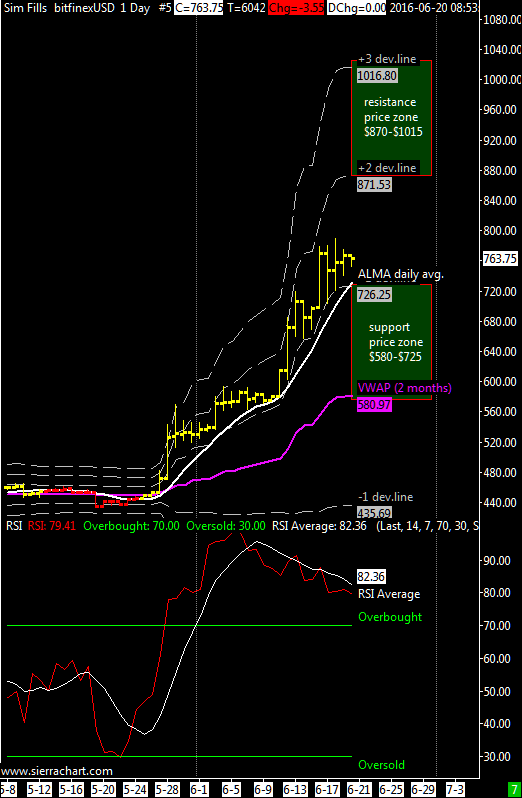
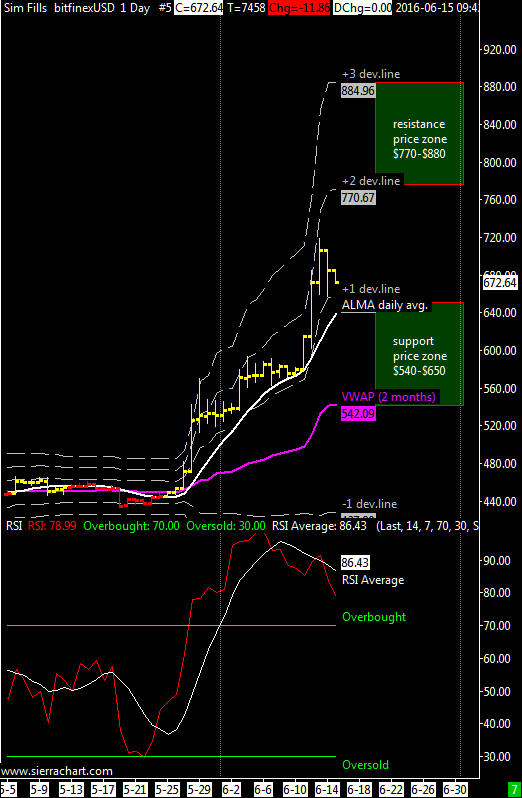
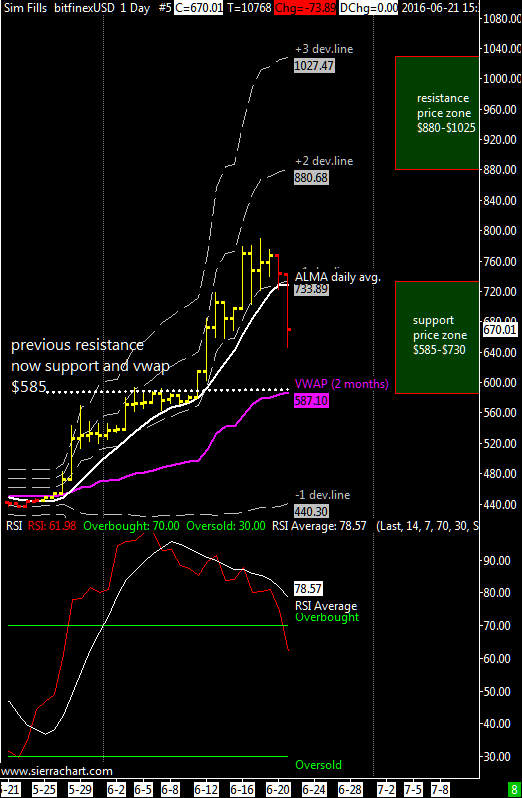
Short Term Update

I revised the weekly range forecast to $320-$400, this price range should work also for the next week. First support lie at $345 and is valid till sunday, then for the next week i see $320 as a good support. What is happening to btc? Well after a double top the market decided to correct a bit, at this point i think that is reasonable to expect a weekly mid-term correction that should end around $280-$300. I still think, after years, that we can’t have a prolonged bear market if the network hashing speed is constantly increasing, i’d be much more worried of a dropping network speed instead of the price that most of the time is wildly influenced by massive volatility typical of an illiquid asset like this one.

bitstampUSD  1 Day   #5 2016-01-16  09_53_13.305

I’d like to conclude spending two words about the recent media havok about bitcoin’s future ignited by a recent open letter from a blatant liar with an inflated ego, i prefer to not enter in details but as more the media erupts against bitcoin as more bullish is the future of bitcoin itself. I like very much to use the media as a contrarian indicator for investment decisions because the entire art of speculation consists of choosing the perfect moment to invest in a way opposite to that suggested by popular opinion.

Once things settled down there will be a long term update aiming to understand if there is the opportunity in the coming weeks to average down my long term position.


Long Term Update

“One Look at the chart Is Worth A Thousand Words”

chart

One week ago the chaikin volatility indicator crossed again the zero line, i think that since then XBTUSD entered in a new upswing after the strong bullish bar of the 26th November.
In terms of static price levels it seems to me that $320 is a strong one, followed by $360 that should hold the price during this upswing. As i said in my previous update i think that the maximum extension of this new weekly upswing should fall in the $650-$700 price zone: How much you wanna bet?


Weekly range forecast $360-$440

Long Term Update: Again on volatility

After having proposed with my previous update an interesting template about volatility breakouts, I introduce today a well know indicator about volatility: the Chaikin volatility indicator. Most of those who follow me probably already knows that volatility is ultimately responsible for a traders profits, since if a market does not fucking move (like btc is doing since September) then there is no way to make money from it:)
It’s therefore crucial to recognise those times when volatility is picking up as this offers the opportunity to make a decent trade.
Developed by Marc Chaikin, the Chaikin volatility indicator characterize volatility by calculating the difference between the high and low for each period or trading bar. It measures the difference between two moving averages of a volume-weighted accumulation distribution line.

As you can clearly see when the Chaikin is below zero nothing is going on in the market and during these times you should refrain from trading and wait for the Chaikin to tell you when things are getting interesting. Chaikin is thus excellent to avoid overtrading.

chart

Once the Chaikin peaks, you know that you can start to think about closing your trade or opening a new one in the opposite direction (less recommended).
About the recent prolonged period of low volatility i’m observing an increased volume activity among all the biggest bitcoin exchanges, this let me think that bitcoin is probably accumulating to later break the trading range and move above $250. This break would be confirmed with a positive reading of the Chaikin Indicator (standard settings of 10/10 applied to a daily chart).

If you want to support this blog you can open an account at bit4x using my referral link, clicking here . Thank you.

Short Term Update: headed to $255

The price of XBTUSD has dropped again today back to my short term support at around $275 where i’ve my first positive price deviation line (computed using 2 months VWAP). From here it’s unlikely to see a bullish reaction and i expect a further bearish development down to the 2 months VWAP at $255 (see pic). I’d be really surprised to see a reverse from here but it would mean that the strong uptrend is still in place. A test down to $255-260 price zone could be an interesting short term buying opportunity.

bitstampUSD  1 Day   #5 2015-08-01  14_49_05.696

Regarding my long term view my opinion hasn’t changed much, i still think that the bear market is over and this market is accumulating in this prolonged sideways move; a strong breakout above $300 will follow later this year or in the first half of 2016. As long as it stays above $210 I’m continuing with my bullish bias.

Short Term Update

It’s been a while since I have taken the time to post an update and I’ve been feeling a bit guilty about that to be honest! I remind to everyone that every monday i post a small update on my twitter profile, so keep an eye on it.

You see, the XBT/USD is approaching $200, and I think it’s headed lower still. We could see it reach $170 by the end of next month but at the same time i think that this long term drop is pushing the bitcoin market to the edge of a new rally. The main problem is that the downward trend is still pronounced that a visit sub $200 is inevitable.

About the short term, this market topped as expected in the price range i mentioned on twitter last monday, around $239. A new low will be probably established in the $190-$195 price zone as indicated in the attached below daily chart.

image

Short Term Update

image

In the above attached daily chart you can find the usual moving average that i use, the VWAP calculated with the last 2 months of data and its price deviation lines, also you can see the white line that is the ALMA moving average, in the lower pane there is the well know RSI oscillator.
The ALMA average has just moved back into bearish position and I think prices should go down to retest the first VWAP negative deviation line at $212, if the volatility stays low instead I think that $225 should work as support.
For those who follow me in my IRC channel they know that i’m short from $237 with a target variable from 225 to 190 dollars, I decided to open a short position (short term trade) after the market has made a lower top ($268 below the previous one at $310). I’ll remain short as long the market will stay below $250-$270.

In the last 30-40 days i’ve done 2 more short term trades, from $200 to $227 and from $237 to $255, i would like to conclude this update by telling you two words about the long term picture: it’s very simple the long term moving average remains bearish so not yet time to average down my long term position.