Weekly Range Update

xbtusd daily chart
xbtusd daily chart

XBT / USD weekly price range $885-$1090 | As long as the XBTUSD pair remains above the medium term VWAP I don’t see any risks to the current uptrend to continue. The average ALMA is upwards since twenty days and the price has entered the resistance price zone published in the previous update, because of this I’m skeptic to see a further rise above $ 1090 without a correction considering also that the RSI oscillator has entered overbought territory, honestly I think that the odds of a correction are increased but the minimum should occur over the VWAP, above the $880 mark.

As support the VWAP is again valid and is updated to $885 even though first I consider as an intermediate support the $940 price level.

In cases of extreme fall the support area lies between 600 and 700 US.

Italian version at bitchanger.com

Weekly Range Update


eng
Daily Chart XBTUSD

XBT / USD weekly price range forecast 750$-855$ | The main resistance is the VWAP at 855$ and because this market dropped below it for the first time in months we can consider the cross XBTUSD in a weak position and the top at 1140$ done on January 3 is confirmed; to understand how it is positioned in the medium term our beloved BTC’s we need to see where the next bottom will be done.


As support is valid the first negative deviation line of the VWAP at around 750$ although I feel that the next minimum might be around 640$ or the second negative price deviation line of our mid-term VWAP .

In the previous update I wrote about my doubts if the VWAP at 850$ would have hold a second time the decline from the top after stopping that drop already once; the market indeed fell further but remained inside the support area that I indicated at that time.

The average of the RSI daily oscillator has finally drop near oversold levels, not giving a buy signal yet.

In cases of extreme drop support is price area between 580 and 660 USD.

Italian version here at bitchanger.com

Weekly Range Update

eng
XBTUSD daily chart

XBT / USD weekly price range forecast 740$-970$ | The main resistance is the first positive deviation line of the  VWAP at 970$, about support I think is valid the first negative deviation line at about 740$.

I have doubts about whether or not the VWAP can hold the price for a second time after stopping the previous drop from the high of January 3. I believe that during this month we might see the price slowly drifting down to 740$.

The average daily RSI oscillator moved below the overbought zone technically giving a sell signal but for the moment I decided to ignore it waiting to see if the price will remain above or not our main support, the VWAP.

In case of extreme fall the support is the price area between 580 and 660 USD.

Italian version here at bitchanger.com

Short Term Update: VWAP levels

eng
XBTUSD daily chart

I think that XBTUSD is rebalancing itself after what i consider a buying climax bar of January 3.
It’s very important to stay above our mid-term VWAP at 840$ but considering the high volatility of these days it’s not excluded a test below it, eventually down to $720.

This price zone (720$-840$) might be a good spot where to buy because the overall trend is still up. I don’t think this drop will continue down to the yearly support of 500$ that i wrote about in the 2017 outlook of few days ago.

The daily RSI has been overbought for a prolonged period and its reading is around 50.

The situation with a very short term VWAP (7 days) see XBTUSD in a weak position below our average. With a move above 1010$ XBTUSD would regain some bullishness in the short term.

eng

Short Term Update: 7 days VWAP

eng
XBTUSD H2 Chart Bitstamp – VWAP 7 Days

XBTUSD remains pointed higher, but may see short-term weakness down to the 7 days VWAP at 1030$ (1040$ for kraken and 1000$ for btce exchange).

Waiting for a dip to support before looking for fresh longs; risks of momentum slowing is on the rise without retracement if price moves below the short term VWAP.

RSI is close to oversold and i think that in the next hours there should be an intraday bottom, good opportunity to buy if market stays above VWAP.

Long Term Update: 2017 Outlook with entropic methods

Every beginning of a new year i post an outlook using entropic methods explained in the technical section of this blog. Here you can find the 2015 and 2016 forecast update, where you can find more information about this approach.

Updated values for bitcoin (in brackets values of last year)

 BTC/USD
Growth Factor G 1.000722 (1.000166)
Shannon Probability P 0.519 (0.515)
Root mean square RMS (see this as volatility) 0.045 (0.053)

Bitcoin’s entropic values versus the Usd improved a bit in 2016, with volatility that is dropping and a larger value for the growth now 0.000722% compounded daily or 30% yearly growth up from 6% of 1y ago. Also the optimal fraction of your capital to invest in bitcoin improved in 2016, to minimize risks you can invest in bitcoin up to 6.4% of your total wealth.

 2017 Price forecast  Full volatility  Half volatility
Forecast using only G* ~1235$ ~1235$
Upper bound adding volatility ~2900$ ~1900$
Lower bound subtracting volatility ~520$ ~800$

*1320 is obtained with today price (around 950$) times (1.000722^365)=~1.30
950*1.30=1235, just change 365 with the number of days you prefer for a different forecast.

Conclusions

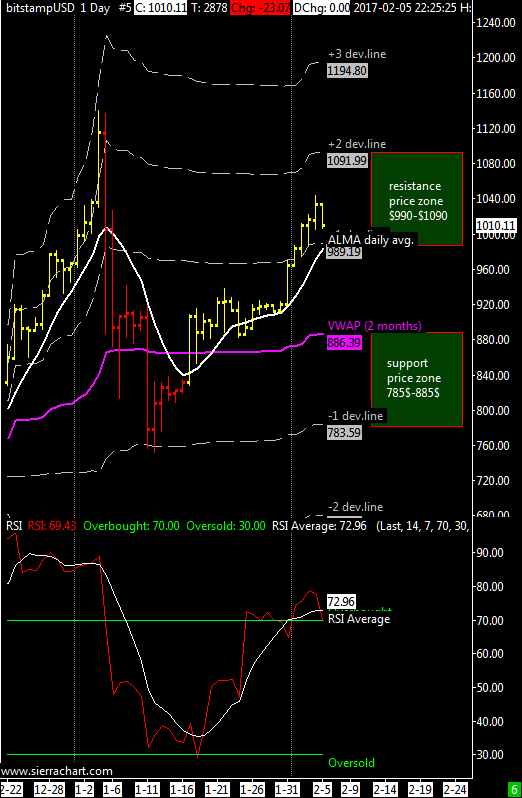
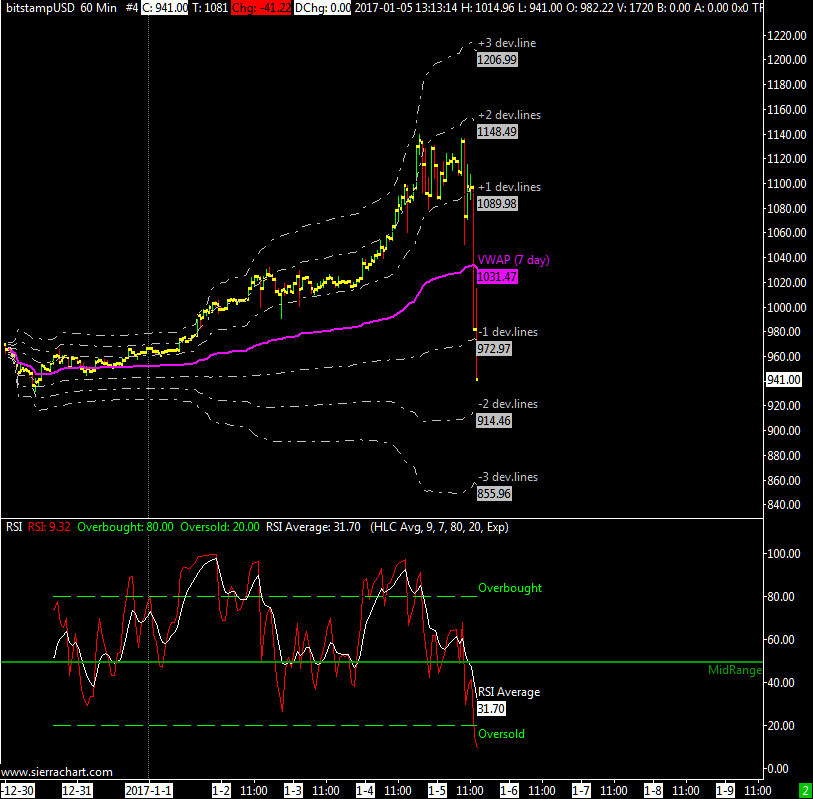
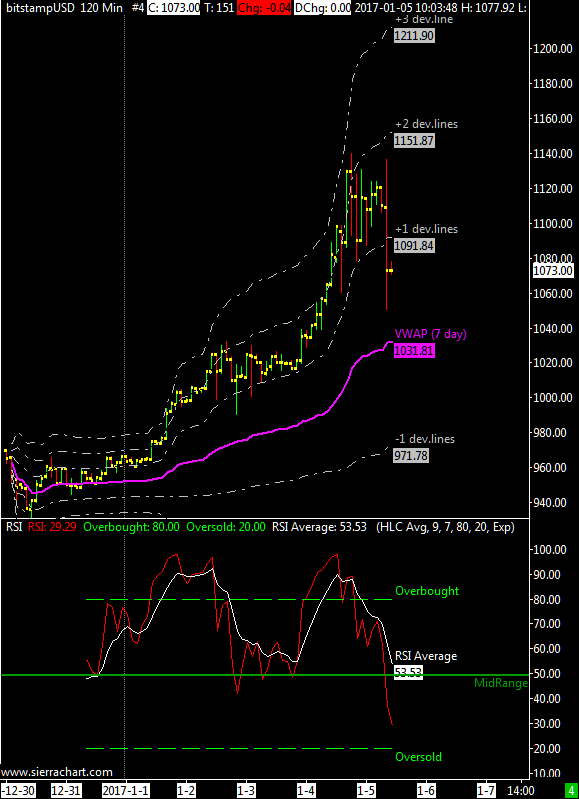
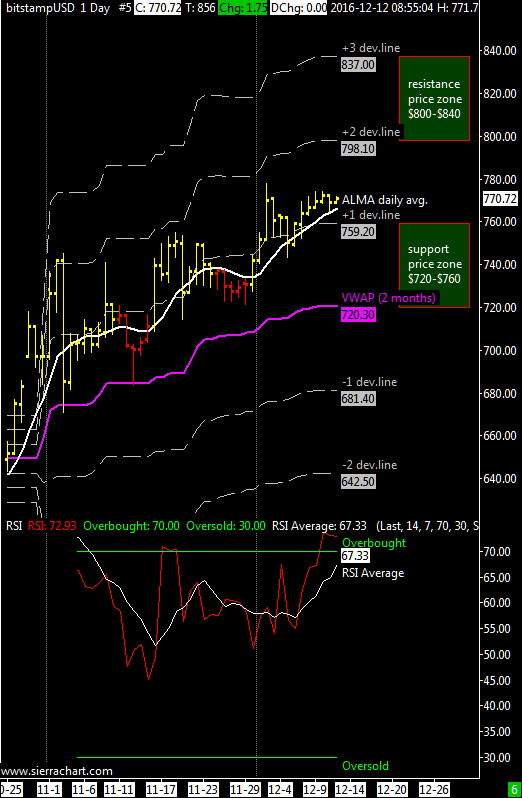
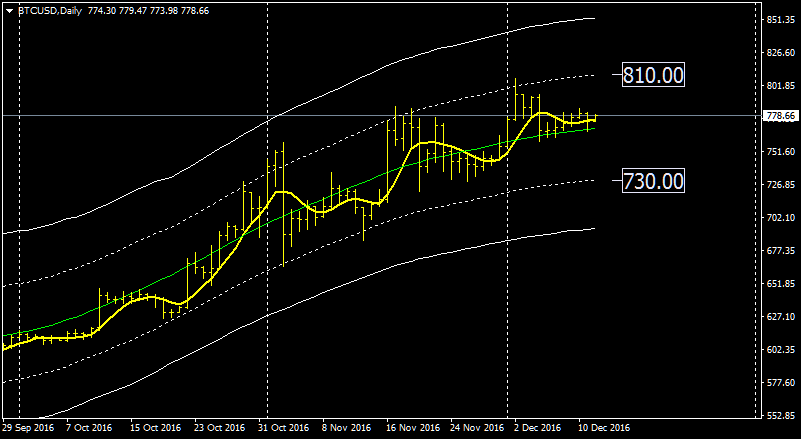
Also for this year i recommend to consider the support/resistance levels obtained with a halved volatility value with the result to have for the whole 2017 a good probability to stay inside the 800$-1900$ price zone with a strong support at around 520$ in case of panic selling.
At the same time i think that at the end of a strong buying climax period, if any, it will be difficult to see the price of a bitcoin over 2900$.

I want also to emphasize the fact that year after year the volatility of Bitcoin is falling although it’s not yet at the level of traditional investment assets like stocks, neverthless this is a good sign and it tells us that bitcoin as an investment asset is improving.
To give you an idea consider that the volatility of the SP500 index is 6 times less then Bitcoin and a stock like Apple is 3 times less volatile then Bitcoin. Keep in mind that during the 2013 peak bitcoin volatility was twice what it is now.

I’m at your disposal for any questions; see you at the next update and Happy New Year!

Weekly Range Update

engXBT / USD weekly price range forecast $760-$800 | Even this week the support/resistance levels remain the same, the main resistance is the second dev. line above the VWAP at $800 while the support is still valid the VWAP at $720 approximately but with these levels of low volatility i think it will be support the first dev.line above the VWAP at $760. This week we’ll see if there will be enough energy to break the $800 and reach the next resistance at $840 by year-end.

The average of the daily RSI oscillator is in overbought territory. The RSI on the weekly chart is slighty overbought just above the threshold of 70, despite being overbought for some continuous weeks i think that a maximum on the weekly chart has not yet been done.

In case of extreme drop the support is the price area between 495 and 590 US.

Italian version here at bitchanger.com

Weekly Range Update

Daily Chart XBTUSD
XBTUSD daily Chart

XBT / USD weekly price range is $720-$800 | Nothing new also for this week with the main resistance ($ 800) at the second deviation line above the VWAP while the support is the VWAP at about $ 720. As long as the bitcoin will maintain this upward tendency with reduced volatility the levels of support and resistance will not change much, going hand in hand with the advance of the price.

The average daily RSI oscillator is entering the overbought zone. The RSI on the weekly chart is in overbought and above the threshold of 70; despite being overbought for some weeks I think that a maximum on the weekly chart has not yet been done.

In case of extreme drop the support is the price area between 485 and $ 575 US.

XBTUSD alternative template

Let’see now the daily chart template I use with Metatrader 4. As you can see the price levels are similar to VWAP and its deviation lines. At the moment the price is consolidating above the median line of the price regression channel preparing for a move up to $810 in accordance with the $800 resistance provided by the second deflection line of the VWAP. The area around 720-730 dollars will provide support in case of correction.

Italian version here at bitchanger.

Weekly Range Update

XbtUsd daily chart
XbtUsd daily chart

XBT / USD weekly price range of $690-$785 | ALMA daily moving average is slightly bearish, for this week the main resistance is the second price deviation line above the VWAP at $785 while the support I believe it is valid the VWAP itself at about $ 690.

The average daily RSI oscillator is not giving significant indications, it continues to remain above the mid point of 50. The RSI on the weekly chart is overbought but is just above the threshold of 70, it may still report the formation of a Top not having the bitcoin still broke decisively the $750 resistance.

In cases of extreme drop support is the price zone between $465 and $550.

Italian version here at bitchanger.

Weekly Range Update

eng.png
Daily Chart XBTUSD

XBT / USD weekly price range is $705-$750 | ALMA daily moving average is still rising despite a slight profit taking happened during last weekend that does not surprise me, very often amateur investors lose their patience or got scared with the result to sell and cash in their profits; in speculation the hardest thing to do is cut your losses short and let your profits run while amateurs tend to do the opposite.

The main resistance is always the third positive deviation line above the VWAP  at $800 and i still consider valid as support valid the first positive dev. line above VWAP at $705 while the VWAP is at $660.

The daily RSI oscillator reacted after a test to the midpoint value of 50.The RSI on the weekly chart has entered overbought territory by a few margin but not yet completely saturated.

In cases of extreme drop support is now at $465.

Italian version here at bitchanger.

Weekly Range Update

eng
Daily Chart XBTUSD

XBT / USD weekly price range is $ 675-$760 | daily ALMA moving average is firmly upward since 26 September, the main resistance is always the third positive price deviation line above the VWAP at $760, i consider the first  positive price deviation line as support for this week at$ 675, our VWAP average is at $ 635.

The strong rise of the last four weeks is the consequence of the weekly cycle turned up in August. Now it remains to be seen if the market will be able to break through the $ 750 resistance with a move to the maximum target illustrated in my previouos update (the 870$-900$ price zone), it’s obvious that if XBTUSD goes under $ 675 with a possible minimum at the VWAP (~635 usd) then I believe that the Top at around 750$ is confirmed and we will see a correction in the weekly chart down to a new low, a low that will be probably above 450$ because the long term trend is still up.

The average daily RSI oscillator is in overbought zone and I think we can still ignore the information of this oscillator because the dominant timeframe is now the weekly one. The RSI on the weekly chart is not yet overbought but close to the 70 threshold.

In the event of a sharp fall the support is in the area $ 450-460.

Italian version here at bitchanger.com