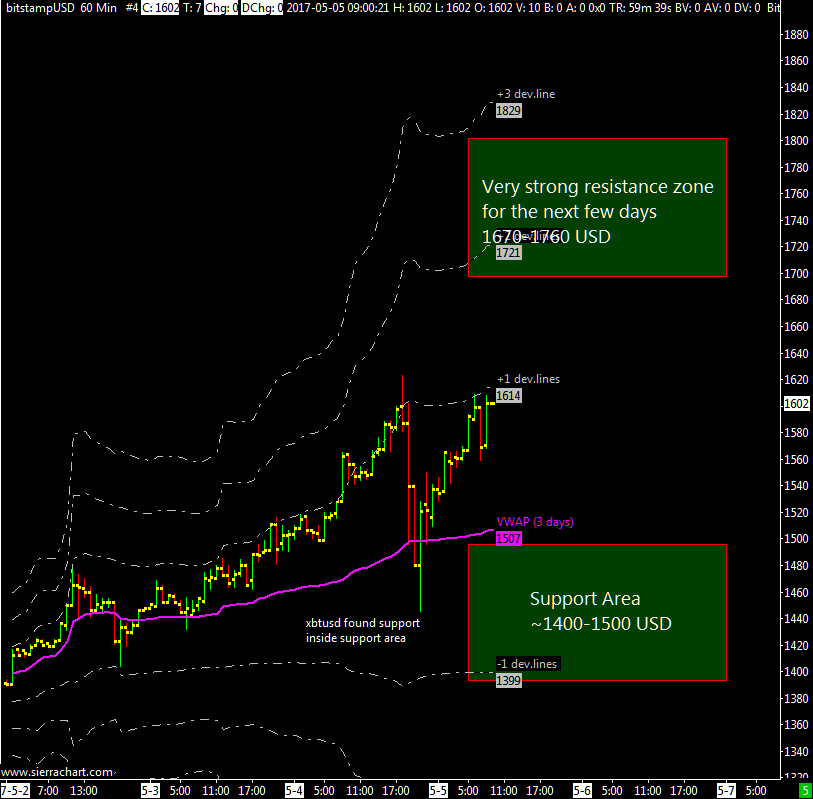
XBTUSD found support inside the support area that i’ve forecasted yesterday, considering the overall bullish sentiment of bitcoin i’d have been surprised to see a bottom below 1400$.
Resistance level should remain the same, starting from 1720$.
As a side note you can see on the attached chart that with a 3 days only chart levels and VWAP change quickly.
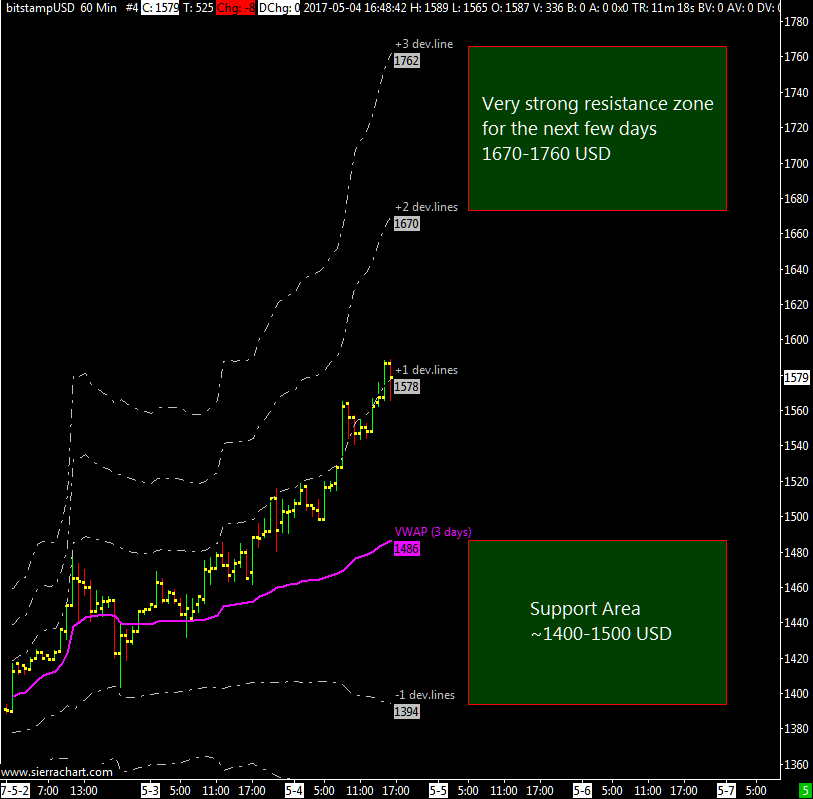
After a decisive breakout of the 1480$ weekly resistance level and because of the high volatility i decided to zoom in with an intraday chart (60 min bar).
Here the VWAP is computed using only the last 3 days and to compute the deviation lines only the volatility of the last 3 days is used, this allow me to have a snapshot of the current situation.
When a market is strong it usually stays above the first deviation line and the second one acts as a resistance, I think that for the rest of the week XBTUSD should stay below 1670$-1750$ with a support area right below the 3 days VWAP (1400$-1500$).
This market is very bullish and it’s quickly accelerating, the volatility i was expecting in my previous update is finally coming to the market.
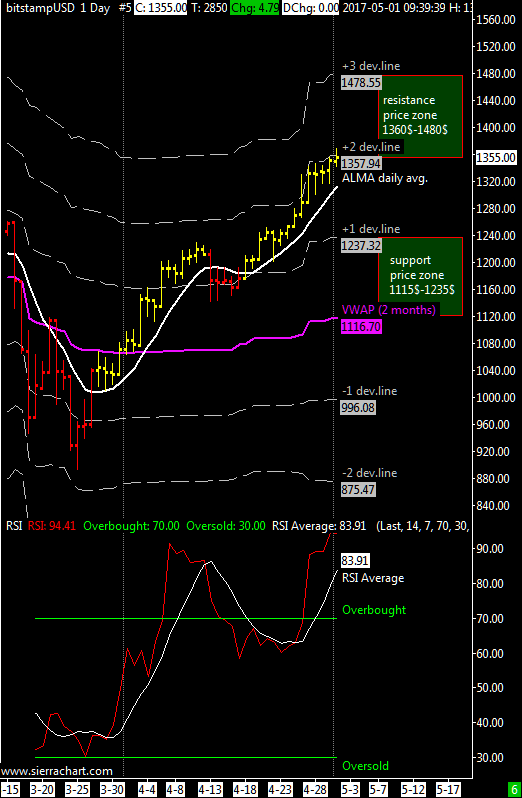
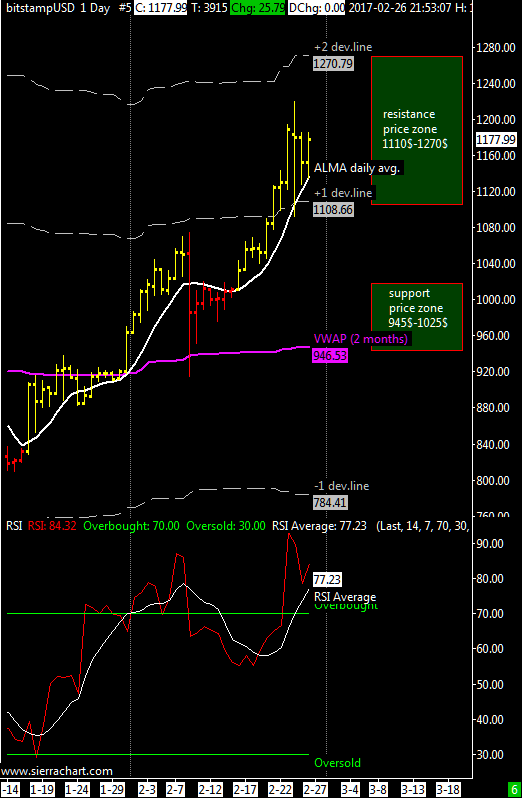
XBT / USD weekly price range is 1230$-1480$. | The XBTUSD pair begins to approach the resistances on both the daily and weekly charts (see previous update for weekly chart), but still remains in strong position above the VWAP now at 1116$.
If there is a break of the first resistance level at 1360 $ there is room to rise up to the next deviation line positioned at approximately 1480$.
I’m reading here and there that because a new maximum has been made above the previous Top, that oscillators are all overbought, others worried about the low volume activity, because all of this many are thinking that an important ATH top is in. Personally I think there is room to go up to another hundred dollars before a correction appears, also i don’t forget that with bitcoin there is usually a volatility peak around a top, a peak that i don’t see yet.
To conclude our daily ALMA average is firmly up and the RSI as I said is in overbought territory. From now on there is the possibility that a maximum on the daily chart is near, just use a common volatility stop (there are many for free also at tradingview) to protect your long position.
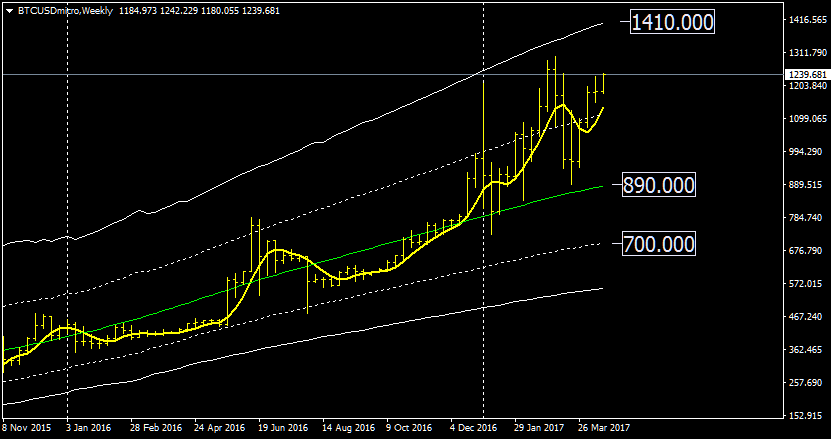
In case of extreme fall, the support area rise to 730-930 USD.
It’s pretty obvious that XBTUSD is staying above the central line of the price channel shown in the weekly chart. The low of 5 weeks ago caused by bitcoin unlimited has been made above the midline of the channel and this is a bullish indication.
As you know, this indicator calculates a regression on past prices and projects resistance and support lines using the average volatility of the underlying asset, if there is sudden shift in volatility the indicator will try to adapt to this new information coming in and the deviation lines will change accordingly.
If volatility change is not dramatic the calculated resistance and support lines will remain fairly stable; at the moment the new resistance area where the next top might occur is between ~1250$ and ~1410$.
As a side note i’d like to add some words about the next top, it is very important to make it above the previous one to confirm the underlying bullish tendency; if bitcoin fails and moves below 890$ the implications would be bearish enough to see a minimum just above 700$.
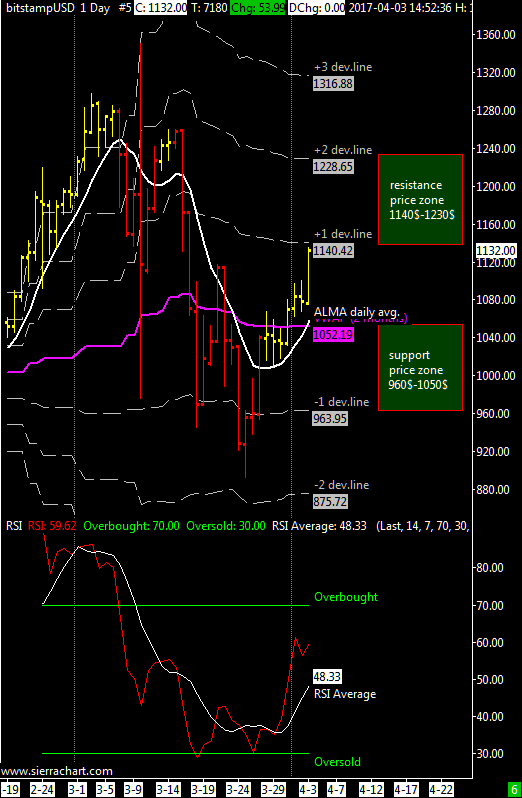
XBT / USD weekly price range is 1050$-1230$ |The market moved back to a strong position firmly above the VWAP level and it is close to a first level of resistance at 1140$, I think that there is room to reach the second resistance level at 1230$.
The average ALMA returned bullish and the RSI has moved away from the oversold area exactly what I was expecting last week: a positive reaction. About altcoins i know that many of you are interested but i consider them too small for a proper and reliable analysis, in fact also bitcoin isn’t enough big; because of this for the time being there will be sporadic updates about altcoins.
In cases of extreme fall the support area is 670$-860$. ITA version here.
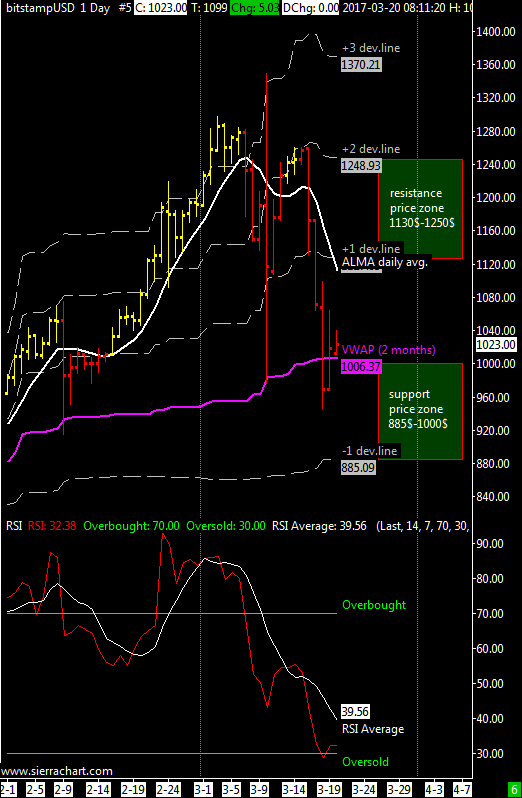
XBT / USD weekly price range is 900$-1125$ | The range for this week is similar to the previous week. XBTUSD remains in a weak position below the VWAP and below the ALMA moving average.
I think that the support at 900$ is solid; resistance levels at 1125$ and 1235$.
The ALMA average is still bearish and the RSI oscillator has made a double bottom just above the oversold thresold. I see the possibility of a move above the VWAP up to 1100$, at the same time a failure to pass 1010$ would be bearish.
In cases of extreme fall the support area is 650-825 US dollars. ITA version here.
XBT / USD weekly price range is 885$-1130$ | The range of this week gives a support area at 880$ and resistsance from 1130$.
In the previous weekly update I said that a close of the weekly bar above 1030$ would have averted the risk of a weekly correction, the market has made a short test above this level and then quickly retreated, so I think that the chances to make a new low are high Determining a candidate level for a bottom isn’t complicated with my long term price regression channel on the weekly chart, this level is 830$ as I showed in my previous long-term update.
The ALMA average has obviously turned negative and the RSI oscillator is almost into oversold territory.
In cases of extreme fall the support area is 650-825 US dollars.
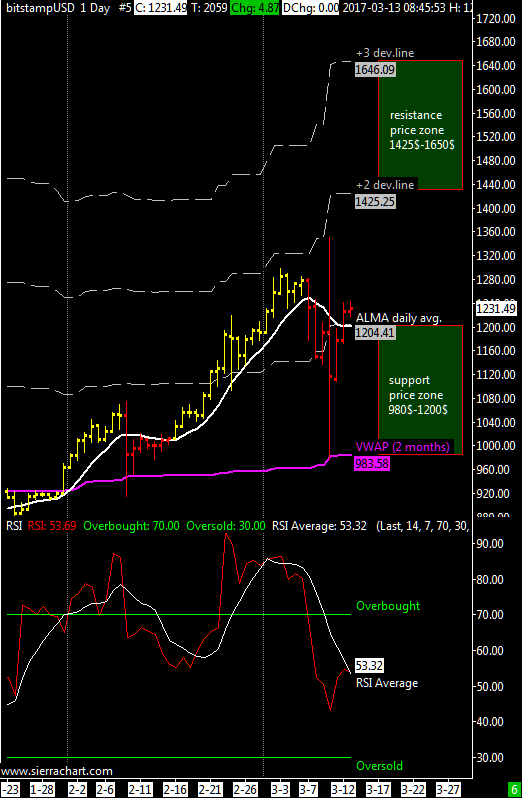
XBT / USD weekly price range 1200$-1425$ | Also this weekly range has been calculated using twice the volatility level commonly used until the situation will stabilize after the great volatility seen during the Sec decision about the etf.
The average ALMA is about to turn upward and the RSI oscillator backed off from overbought territory but not yet gone into oversold.
I think we need a move to new highs around 1400$, it would be a good signal to confirm the uptrend. About the daily bar of 10-11 March i think that this market cleared weak hands, I am tempted to interpret this as a bullish signal.
In cases of extreme fall the support area is updated to 650-790 US dollars.
XBT / USD weekly price range 1125$- 1300$ |The range for this week is intended valid until the SEC decision of next 11 March whether to approve or not the first bitcoin ETF; this is an event that can create additional volatility that can push this market well beyond the 1300$ resistance or generate a violent correction down to the VWAP, now at ~950$.
The ALMA moving average remains firmly upward; as you can see in the left attached chart in a strong uptrend hardly the minimum of the day is below this reference average I use.
The RSI oscillator is in overbought zone and essentially confirms that the market is strong but still a top could be in the making. There is also a strong resistance in the weekly chart around 1370$-1400$.
In cases of extreme fall the support area is updated to 610-740 USD.
XBT/USD weekly price range 1025$-1270$ | Also this week the cross XBTUSD has been stronger than expected so I decided to propose something different for this week about the calculation of the levels of our 60 days volume VWAP. The resistance zone is wider and goes up to 1270$, the VWAP is slightly moving up and now is at 945$ though more probably the intermediate level at 1025$ should hold any violent intraday corrections. The ALMA average remains firmly upward.
The RSI oscillator is returned in the overbought zone and essentially is confirming that the market is strong but i still think that an intermediate top might form soon, not eventually a yearly top because i expect higher prices later this year.
About the calculation of the VWAP deviation lines I doubled the volatility coefficient for this week because since few weeks the volatility is high and often this market has broken through my resistance lines. Just for curiosity the third deviation line pass at 1432$.
In cases of extreme fall the support area is 665-775 US dollars.
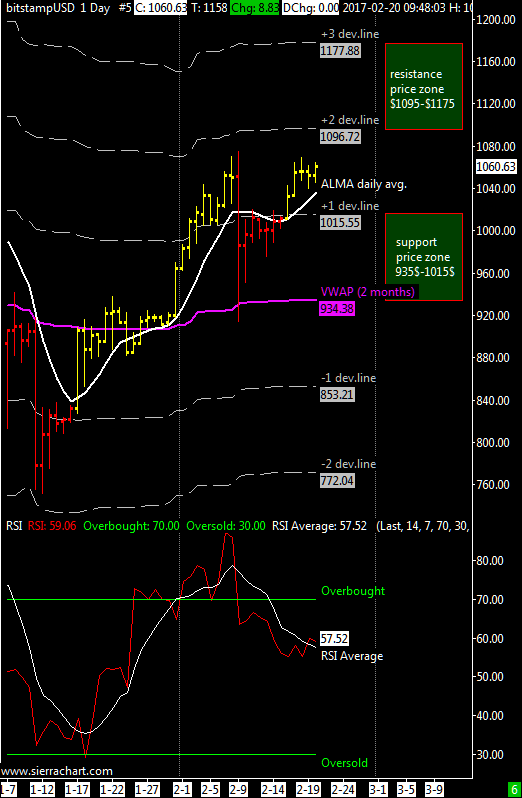
XBT / USD weekly price range is 935$-1095$ |Last week the cross XBTUSD has been stronger than expected so for this week the resistance is raised to 1100$, the support remains the VWAP at 935$.
The ALMA average has turned upward with the break of the resistance at 1015$ while the oscillator RSI has given a sell signal last week that has been ignored by the market confirming the strength of the bitcoin-dollar cross.The RSI has however pulled away from the overbought zone but remained above the mid-point of 50, thus remaining in bullish territory.
In short, the market is strong and has ignored my bearish worries of seven days ago;regarding my long-term position opened since 2014 I’ll continue to maintain it until I see some serious bearish indications on the weekly and monthly chart.I remind everyone that the average carrying price of my position is around 570$ (three units opened at 681$ , 615$ and 417$ ).
In cases of extreme fall the support area is updated to 650-760 US dollars.
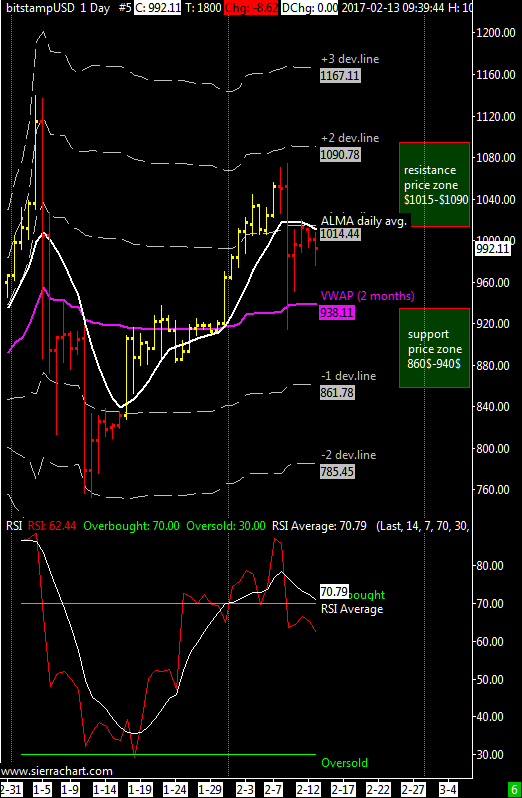
XBT / USD weekly price range is 860$-1015$ | This week the cross XBTUSD appears a little weak now that the ALMA moving average has turned bearish, and the RSI oscillator average (white line) is on the verge of giving a bearish signal.
A test under the VWAP, under 940$, might be possible; if this scenario materializes then the 860$ support should hold well.
It is valid, as resistance, the first dev. line above the VWAP at about 1015$.
I remember that in any case as long as the price remains above our VWAP average the medium-term uptrend remains intact.
In cases of extreme fall the support area is 635-735 USD.