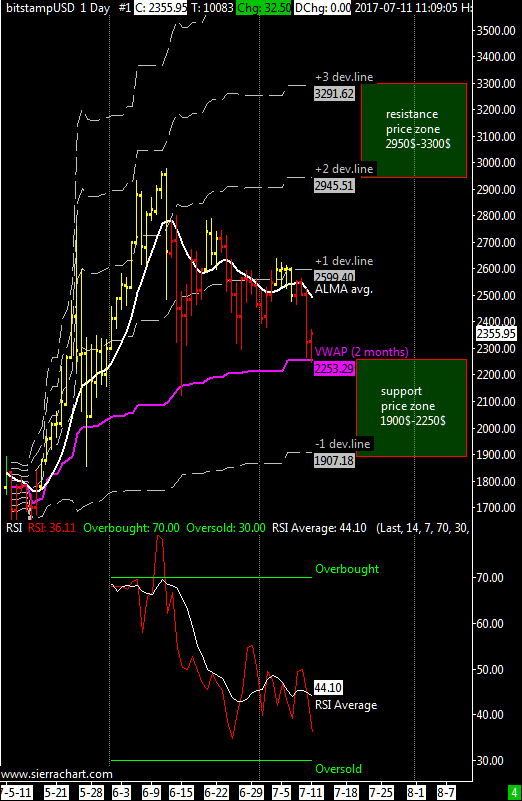
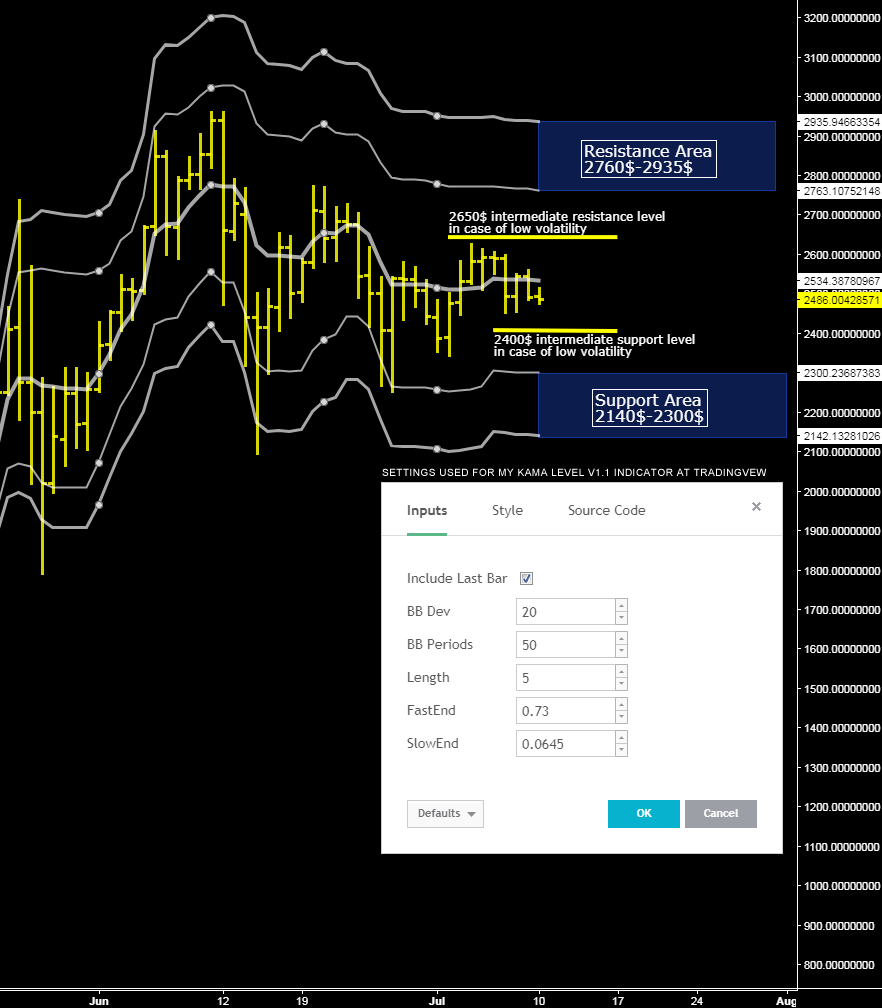
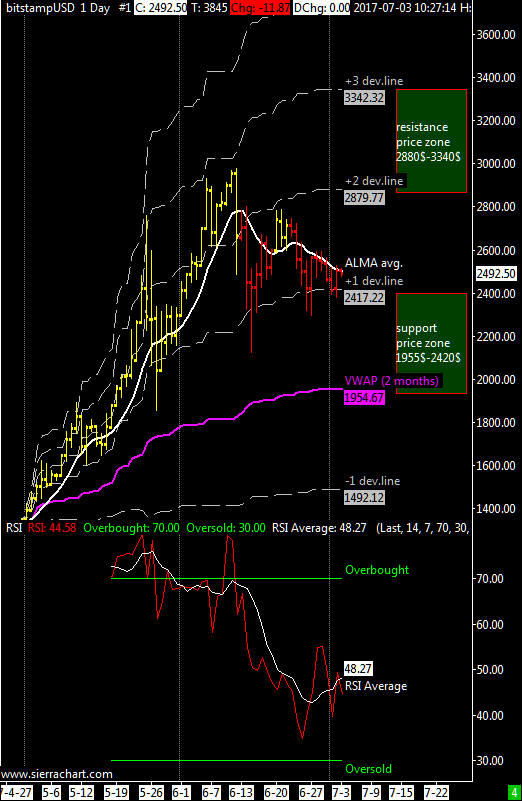
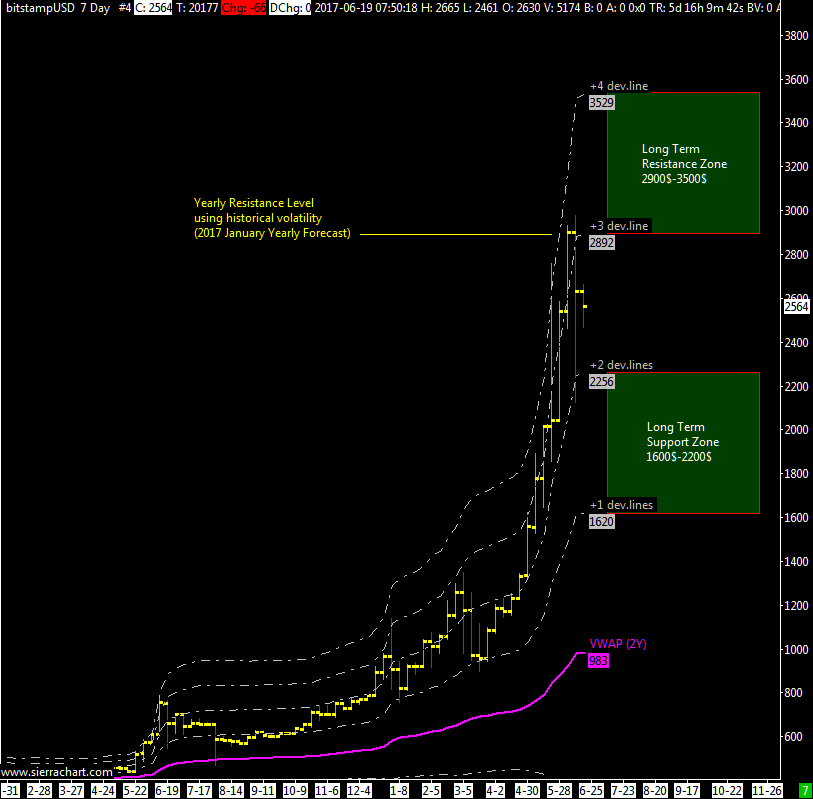
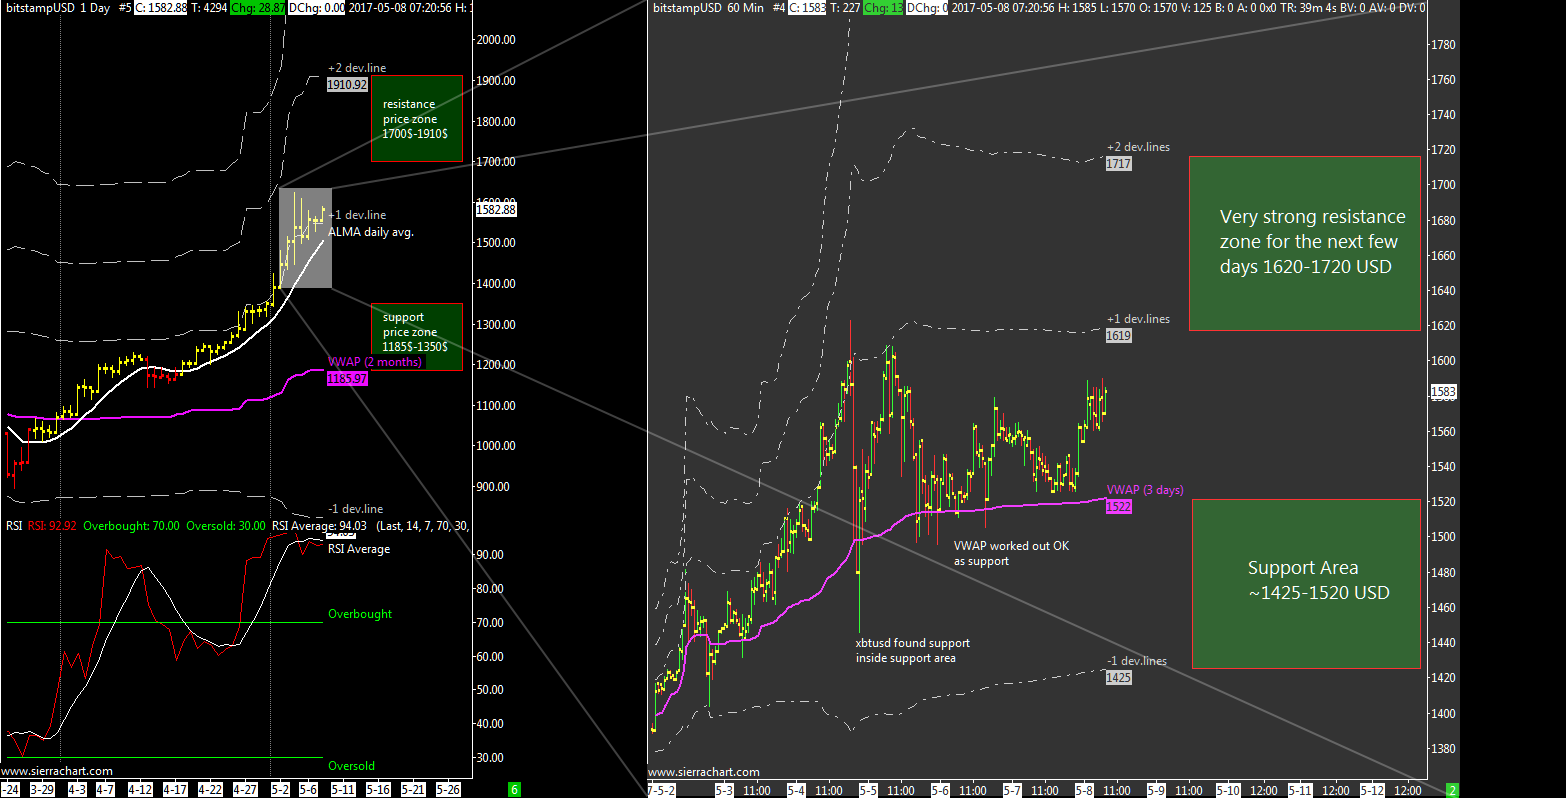
This chart has been often proposed over the last few weeks for those who follow my updates on Twitter, it represents a weekly chart with my KAMA average and deviation levels. I’ve added 2 months and 1 year VWAP average to get a wider idea of possible valid support/resistance levels.
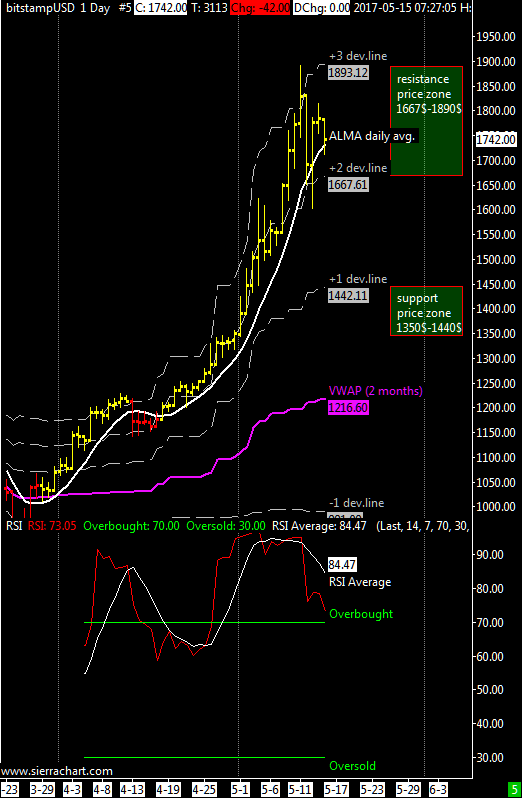
The sell-off of these days seems to have found support within a support price zone defined by the deviation levels of my KAMA average. It would be ideal to have the bottom above the maximum of the previous cycle, in this case the maximum done at 1350 $ last March 6, better would be to see the bottom inside the area between 1600 and 1900 dollars.
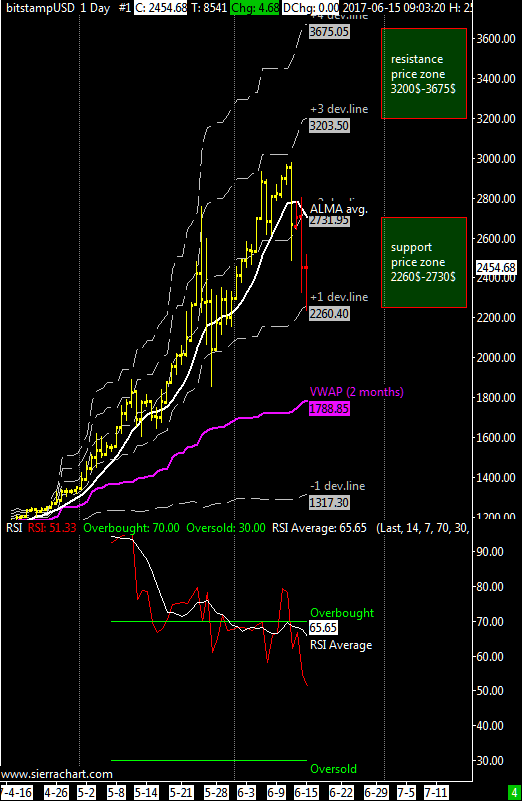
In the current rebound the 2-month VWAP average should act as resistance, for this week we should not see prices above $ 2300 and not below 1600$.
In case of further downside volatility a strong support is 1600$ and 1 year VWAP should provide support at 1150$ in case of a catastrophic event.