Again on VWAP

chartIn the last days we have seen an extremely volatile market, with the yo-yo behaviour of the last thursday, it is easy for an amateur speculator to get slammed during a 33% correction. In this situation a better approach is to try to figure out whether current prices are high or low relative to a normal price range. If you can do this you can begin to trade any market with confidence and VWAP is a powerful tool do to this.

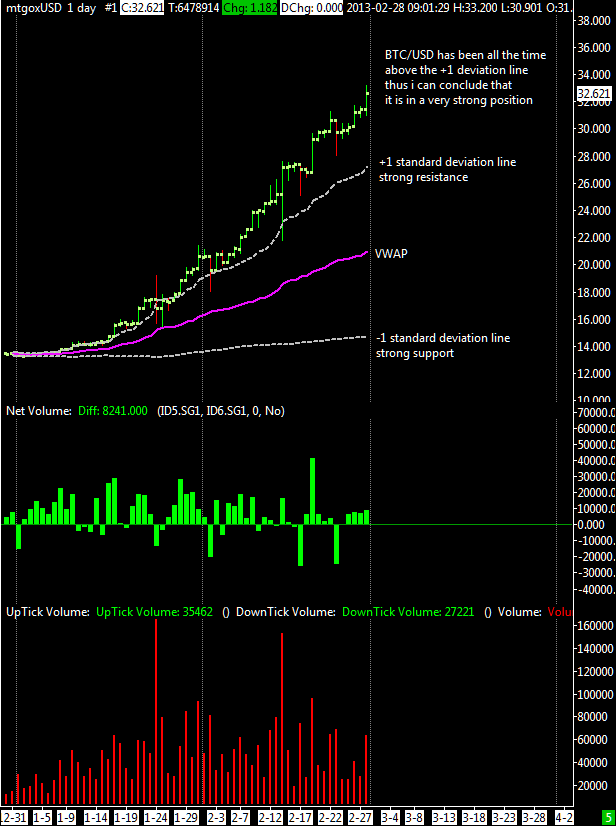
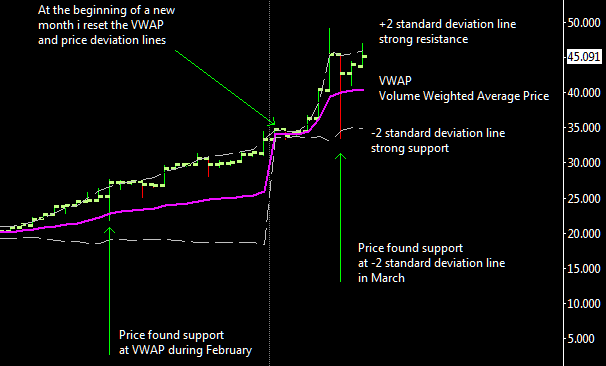
I do that, thanks to Sierrachart vwap add-on, computing support and resistance with an estimation of current volatily and the time considered for the forecast (cumulative since day 1 of each month as illustrated in the above chart). So if the market goes under the -1 or -2 standard deviation line support and then you have a buy signal you may try to “take a stand” or basically telling everyone that you think the market is under priced and telling to other market partecipants that they might have made a mistake by pushing the market too low. It is visible in the attached chart how VWAP give support if volatility is not extreme and if so market can find support at the -2 standard deviation line as happened 3 days ago.

On a weekly basis, the trend is still up, trading activity is growing and show an increasing volume activity. The weekly moving average is unaffected by the recent wild daily swings, only if price stays below the VWAP for many days drifting lower and under 35$ then i can conclude that the long term trend reversed to the downside with a  downtrending VWAP line.

For who use Sierrachart  to follow MtGox with slush plugin, i’d to inform you that now is possible to follow also MPEX stocks with real time quotes with a plugin licensed by kakobrekla, you can contact him at bitcoin assets irc channel for more detail, IRC handle is kakobrekla

Short Term Update: Introducing a new tool, the VWAP

chart

This is a short term view of last 2 months when this market started to rise from 13$. On the chart i’ve attached the VWAP or Volume Weighted Average Price. VWAP  is equal to the sum of the volume of every transaction multiplied by the price of every transaction divided by the total volume for the trading day.

The theory is that if the price of a buy trade is lower than the VWAP, it is a good trade. The opposite is true if the price is higher than the VWAP. But, because of the great strength of BTC/USD, in the last 2 months rally the price has been always above the VWAP so it’s hard to say now if it is a smart move to sell. I’ve added on the chart also 2 standard deviation lines (+1 and -1) , the standard deviation is computed using differences from close and vwap.

Btc/usd at the moment is drifting up following the +2 deviation line (not  plotted in the attached chart) and it is very bullish. A good entry point could be a drop to the +1 deviation line at ~27$.

Understanding how price interacts with the VWAP price and its standard deviations dramatically fine tune both entries and exits and gives you a professional edge.

Here’s another example with an intraday chart of today:

chart

Chart starts at midnight of 28 February GMT time. As you can see the deviation lines provided both support and resistance giving you an edge on where to place your entry and exit point. Note how the price interacts and extends beyond the VWAP testing the 1st upper standard deviation. Next deviation line is at 33.8$ for today. For who want to give it a try, hit F6 on a sierrachart chart and select the indicator named “Volume Weighted Average Price” from the “Studies Available” list on the left. On the same window, on the right, there is the “Studies on the Graph” list where you can select the added VWAP and customize options. For intraday i recommend to set the VWAP options to:

  • Input data = last price
  • Time Period Type = days
  • Time period length = 1
  • Distance Multiplier = 1 (or 2,3,4 to see bigger deviation lines)
  • Continous non resetting std.deviation line = no
  • Continous non resetting mode = no
  • Base on underlying data = yes
  • use fixed offset instead of  std.deviation = no

Short Term Update: MtGox daily chart

This is a short term view of last 3 months,the market after a long accumulation period spent at 13$ exploded to the upside without any resistance.

chart

I’ve talk about a target area at 24-26$ in my previous update, btc/usd reached this target area very fast but considering the strong reaction seen from the last low at 21.7$ i think that at this point is unlikely to see a drop , bulls are still in control of this market IMO. Instead  i’m more for a consolidation around 27$.

If 22$ got broken then i think it is a confirmed short term reverse and it might last some weeks but i’m confident that bitcoin will remain above 22$ for the upcoming months.

Every time the bears tried to push down the market the bulls quickly stepped in supporting and pushing the market higher, this is a typical behaviour that manifests the high level of bullishness in this market.

To conclude i’d like to add that this market has surprised me with its persistent strength. It appear the bears have simply walked off to the sidelines and waiting their turn to feed, probably ABOVE the all time top of June 2011 at 31.91$.

Personally i think that this year we will see an higher top,  at least at 45$, but it is not excluded an higher top at 75$, all depends from the level of volatility that there will be.

Short Term Update: MtGox Daily Chart

chartAgain, i’ve just seen a 2 day break as the one seen last January 24, market dropped less this time about 19%, against a 25% correction of the January drop.

For the moment, i decided to raise my stop profit to 15.00$ and give the market few more days to see if it will rebounce from here, looking the net volume i see just normal corrections of a strong uptrend and i’m not worried.

This week BTC/USD currency pair should stay above 17$ and below the upper end of the price area i defined for this week, 24$-26$

Quick Short Term Update: MtGox Daily Chart

We have just seen a 2 day break and the question is whether or not it is just the first stage of something bigger; i’ve the answer and the answer is no, i think bitcoin will hold the 15$ level, 15.4$ was also the old August 2012 top and i think that now this level defines a price support area. I don’t expect a bearish development after the prolonged period of accumulation spent at 13$ that fueled the rally up to 19$, and as long as it stays above 15$ level it will have an upside potential the bitcoin/usd currency pair.

To conclude looking the net volume i haven’t seen a big aggressive selling activity during the sell-off, buyers supported very well the drop and i interpret this as bullish behaviour.

chart


Short Term Update: MtGox daily chart

chart I was expecting a major drop after my last update but BTC/USD reacted immediately and at the moment it is finding resistance at 13.5$ where the ask side of the book is heavy loaded up to 14$ and for the short term i think bitcoin will need more time to get through that resistance zone.

After 23 price bars (or 23 days) spent after the break out of the 12.7$ level (happened on 4 Dec) and considering that usually a congestion may last up to 30 bars, i think that in the next 1-2 weeks bitcoin will finally take a decision and it will go somewhere above 14$ or below 12.7$; considering the underlying long term trend the odds are for an upside breakout.

In the last month, when a small intraday drop occured, every time buyers stepped in buying this market, this is not bearish but bullish behaviour, i dont see aggressive selling activity because sellers probably want higher prices and have lifted their target selling prices and they are unwilling to dump at these prices their coins. This is my interpretation of what happened in the last month after the halving date.

Price range for next 1-2 weeks is 12.6$-14.15$

Happy New Year and see you guys in 2013.

Short Term Quick Update: MtGox daily chart

chartBitcoin to Usd currency pair so far has completely ignored the first block halving of its history, i see some resistance at 12.6$ and looking the book is not so bearish.

Volatility stays low, i don’t expect the market to go under 11.7$ next week with this level of volatility, so for now the market is still in an uptrend, the key level to break is 13.1$, above it i’ll open a long term trade with a wider stop loss, probably under 9.5$

For the short term i compromised the recent buying opportunity  because i’ve preferred to wait the halving block date. For who is already long in the short term and he is not interested to hold for the long haul would be wise to watch out the 11.5$ level as a potential stop loss and the 13$-13.4$ price zone where to cash profits.

Short Term Update: MtGox daily chart

 BTC/USD completed as expected the rebound up to 12.40$ i think that it will remain under it for the remaining part of this week. In my previous update i’ve said that i’d have considered a buy above 11.3$, well i’m not too much convinced for a mid term up movement because of the upcoming block halving date (it’s expected to happen tomorrow), it’s the first time that such event happens and i think that there is an high expectation by investors to see an increase in price, this is the main reason that let me think that this expected rise have already been discounted and when the halving block will happen it’s not excluded a serious drop.

In any case i’ll probably try a short term trade if the market retraces down to the previous resistance of 11.3$-11.5$ after the halving block date, if a more serious drop will take place i’ll stay out.

Quick Short Term Update: MtGox daily chart

This is a short term view since the recent bottom at 9.74$, BTC/USD just broke an ascending triangle going above ~11.30$, i interpret this as a first sign of a weekly reversal, it’s too early to draw a final conclusion so if i dont see more bullishness in the upcoming days i remain stick with my bearish view.

If a new daily swing has started then the price range forecast should be 10.34$ – 12.40$, if this market will go above 11.6$ in the next days then i’ll consider a buy.

The recent adoption of bitcoin by WordPress it’s a very good news to improve the popularity of this currency but i’m not sure if it will have an impact on bitcoin prices in the short term.


Short Term Update: MtGox daily chart

This is a short term view of the last 25 days, BTC/USD completed as expected the rebound up to ~11.30$ and this week market kissed again that level without success, i think it will remain under it for the remaining part of this week and probably also the next one.

Price range forecast is 9.70$-11.60$, as you know I think that there are chance to see this market going down to 7$ 8$ but before it has to go under 9.70$ with a strong selling activity. For the time being i stay out from this market, i’ll abandon my bearish view of the market only if i see a strong break out of 11.60$ level.

For this week end i expect to see a modest drop down to 10.5$, eventually 10.2$.

Short Term Update: MtGox daily chart

This is a short term view of October,the market after a long weak phase spent at 11.8$ started with decent volume to rise.

I’ve talk about a maximum target of 12.8$ for this month (after the huge drop of first days of October) in the previous update, at this point is unlikely to break it , i’m more for a consolidation around 12$.

As you can see in the chart the net volume spiked showing that some investors are coming back in this market, i think that the fear of a collapse is fading away and it will not return if price stays above 10.6$ where i’ve also my monthly moving average (around 10.5$) is providing support.

If 10.5$ got broken then i think it is confirmed a reverse on the weekly chart and it might last some months but i’m confident that bitcoin will remain above 10$ for the upcoming months.

Short Term Update: Daily chart at MtGox

This is a daily chart of the last few days since the moderate drop from 12.68$ marked on the chart,  buyers slowly moved back into BTC/USD long positions.

I think that the correction is over and now i computed a new conservative target for october around 13.30$, but  it shouldn’t be impossible to touch the 13.7$-13.8$ price zone.

I expect this market to be supported in the 11$ price zone defined also by the monthly moving average and not only by the consideration i’ve made on the previous update about this price level. Looking the net volume on the monthly chart i think the picture is very  bullish despite the August quick shakeout, i see higher prices, probably 17$-18$  over the next few months.