Short Term Update: hourly chart @bitstamp

chartYesterday I sold because the price hans’t be able to get through the  VWAP resistance at $630, then it started to fall and after a confirmed bearish RSI signal I closed my position.

During the night (for my timezone GMT +1) there was a bullish signal always from the RSI oscillator very interesting confirmed by the fact that the drop from $ 625 has found support on the 50% retracement of the first bullish swing ($ 382 -> $ 625).

Today it’s interesting to see if bitcoin will be able to exceed the volume moving average now placed at $614.

Short Term Update: H1 chart @Bitstamp

chartI’ll be synthetic and almost telegraphic, the reasons that led me to believe in a possible reversal of the market are:
1) An rsi divergence was forming, a bullish divergence occurs when the underlying security makes a lower low and RSI forms a higher low and this happened shortly after (pointed out in the chart with dotted line)
2) Price was close to the important level of $650,  it bottomed out at $651.54 @bitstamp
3) 667$ was the first negative deviation line using the 4 hours chart

Normally i do not publish on this blog trades so dangerous, completely against the trend and with an high level of volatility, because I am aware that many of you who follow me do not have enough experience to be able to operate in such situations without making mistakes but this time i’ve done an exception. Possible target is the short term average at $780 that is providing resistance, once there i’ll decide what to do. Support level remains at $650.

Short Term Update: 4H chart @bitstamp

chartAfter the initial flash crash down to $542 sellers failed to take control of this market that is currently holding just below VWAP computed using last 15 days of data; the bitcoin price reaction from the bottom has been slightly bullish (price is holding above midpoint level of $766 of the range $542-$990 that represent the first upswing from the $542 bottom) and i believe that we can consider the recent bottom an important one, at least in the short term although i’m not sure if there is enough fuel to move above VWAP at $885 and enter bullish territory.

All these considerations are for the immediate short term, for the long term i’m not completely sure about the direction of the next bitcoin move.

Possible weekly range for Bitstamp is $720-$970 and for BTCchina 4400-5900 CNY.

Short Term Update: hourly chart @bitstamp

chartNot much is happening these days, BTC/USD is spending time above $840 and volatility is dropping (not necessarily a bad sign). I have shown in the graph two trading opportunities, one for a short selling (for who trades at bitfinex) and a buy signal. If the price movement is at least $20-$30 it’s possible to have a decent profit, fee included.

It is true that looking a four hours chart the price is declining with a series of lower Highs and Lows, therefore i should conclude that from now on it has to fall more and establish a new lower low under $542, logic conclusion. Well when it is too obvious in speculation there is always a surprise around the corner; it might drop a bit from here but i think that it’ll stay above my important level of $650.

I’ve added a moving average to the fast RSI i use, it helps in filtering out bad trade signals.

Short Term Update: congestion @bitstamp

chartThe situation is congested, I resetted the VWAP  lines using the last two days to have a picture for the very short term. The RSI oscillator is also congested, it not being overbought or oversold.
In these cases, you have to wait for something to happen to understand what the market wants to do. A possible trading strategy may be to buying bitcoins at the break-up of the VWAP at $ 910 with a profit taking around $ 940, a quick trade for a small profit.

This market is stabilizing above the important midpoint level of 650$ and as long as it stays above it i’m willing to believe that it is slowly preparing itself for a further upmove, probably to $1300-$1400.

Short Term Update: BTC/USD turns down from Resistance

chartBitcoin turns down from the expected resistance level of the previous update. This occurs after price action rose dramatically (around $400  in total) in a substantial bullish correction extending back to the Dec 7 low just above $500. Next downside support target resides around the key $810 price region near the volume average, which is an important support/resistance as explained many times. To the upside, in the event of a breakout above first deviation line, the next upside target to watch resides around the price region of the previous double top ($1150).

Again, a combination of price and time indications has given a nice selling opportunity at $960(rsi sell short signal and first deviation line resistance).

Short Term Update: Bullish again @bitstamp

chartThis night BTC/USD has managed to break above the VWAP, probably because having made a higher minimum at $700 it was already unbalanced to the upside and had enough energy to break the resistance, with now prices trading above the VWAP bitcoin is bullish again, at least in the short term.

The first key resistance is positioned at the first deviation line at 960 dollars. The RSI is overbought and may stay there for long if the market maintains a defined trend, now to get a clearer picture you have to spend time analyzing a 4 hours chart, or even daily. We’ll see it when i’ll publish a long-term update.

Short Term Update

chartThis night i’ve lost a clean buying opportunity at around 5 am (gmt+1 time) , unfortunately as a human being sometimes  i’ve to sleep.
Once rsi cross the thresold you can evalute if to take the trade or not by looking  VWAP lines as an estimation of price position.
Considering the high level of volatility the distance between the lines increased so in these cases you can consider an intermediate level between  VWAP and first deviation line  (not plotted on the attached chart but it is around $670) . So having good price and time indications it was wise to take the trade at around 680$ and it’s preferable to maximize the trade outcome closing it when a resistance is met (the vwap) and when rsi is overbought. Both conditions happened later and this trading opportunity has been a very clean one; very often these market movements are very smooth and natural.

Now BTC/USD is sliding with a reduced speed and it might do an higher low, probably above 650$. RSI indicates an oversold position and my gut feel tells me that a bottom is near the corner, probably 3-4 hours from now.

Eventually you can add bollinger bands and look for a bollinger band squeeze, it occurs when volatility falls to low levels and the bollinger bands narrow. Periods of low volatility are followed by periods of high volatility. Therefore, this behaviour can foreshadow a significant advance or decline. For example a new advance starts with a squeeze and subsequent break above the upper band. Instead a decline starts with a squeeze and break below the lower band.
The bollinger band squeeze indicator is available with Sierrachart, also with the free version. Have fun experimenting it!

Short Term Update: H1 chart @bitstamp

chart
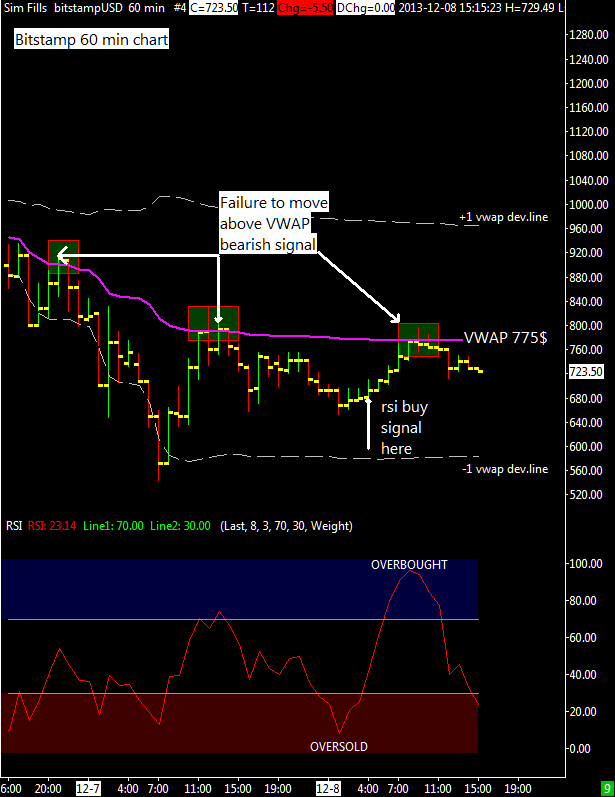
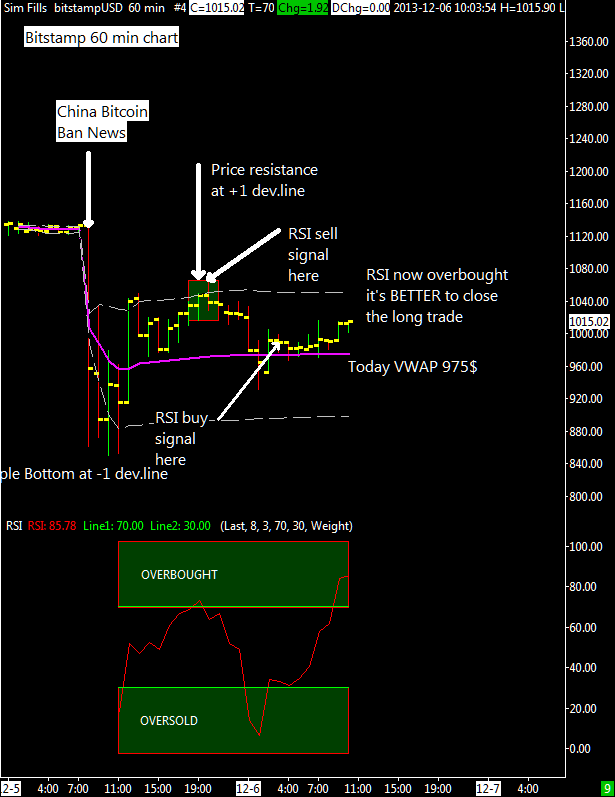
Sellers are taking control of this market after the strong sell-off of this early morning (GMT time), at Bitstamp the market found a bottom at 542$, way below my support at around 700$. Since yesterday breakout of 950$ the market has been always below my short term VWAP, a sign that it is more bearish then bullish with every rebounce ending below VWAP as indicated on the attached chart on the left.

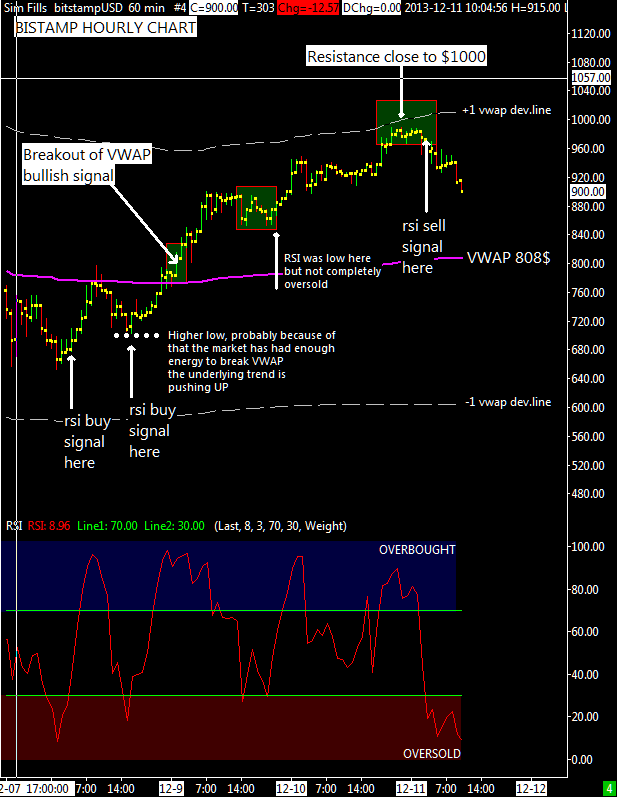
I’m planning to close this short term trade, at the moment i’ve a sell limit order at around $775 . For investors who prefer to hold the position open, it is important to close this week above 700$ and it is necessary next week to see a good reaction (with decent buying activity in terms of volume) to at least $900-$950.

The 50% retracement of this rally upswing (from $140 to $1160) is around 650$ and it is important because what the market do at the halfway level of a major rise or decline is crucial. The greater the move, the more important the 50% principle.
According to this Principle, if the BTC/USD , after all its fluctuations, can settle and hold above the halfway level, there’s a good chance that this end of the drop will rise, allowing the BTC/USD to test its prior high. But if the BTC/USD can’t settle above $650, then the odds are that it will sink further, taking it down to test or even break below its today 542$ low. In this event a bear market might start with a long term bottom around the $250-$300 price zone. As i said, next week will be important to see where this market will settle and hold.
Aniway, despite these considerations, and because at the moment i’m a bit uncertain of what will happen, i’m going to close my trade soon.
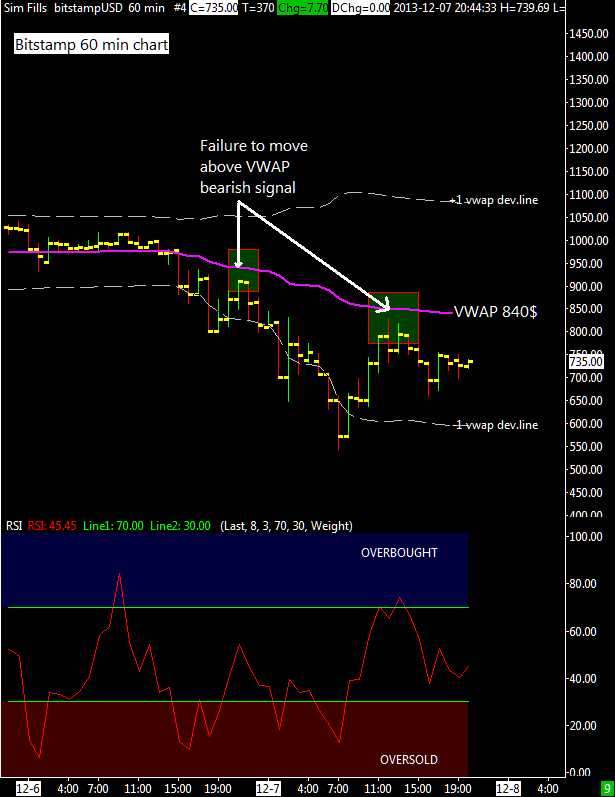
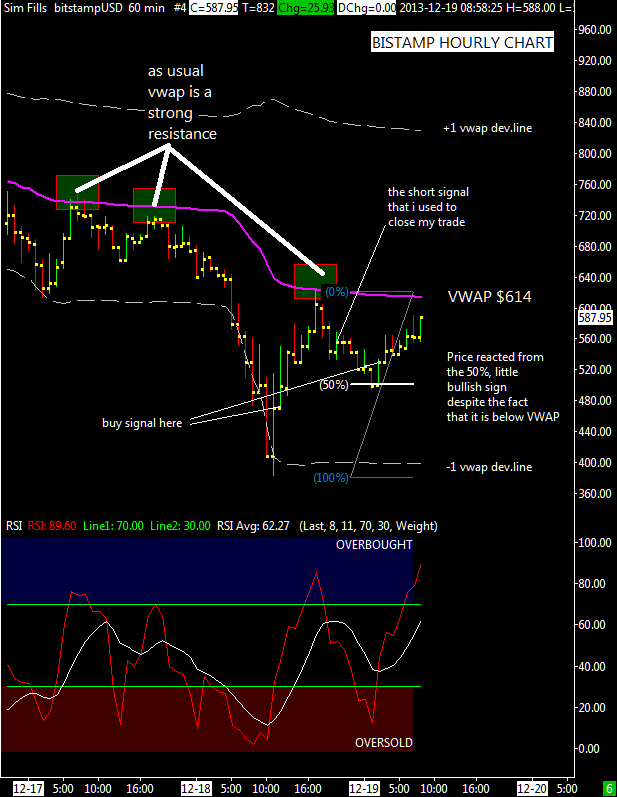
Short Term Update: Hourly chart at Bistamp

chartThe chart you see left this post tell us that the short term tendency is still up, price is still above VWAP with positive netvolume so this is a bullish configuration and as long as it continues the sensible expectation is for higher prices.

I have shown in the graph another trade opportunity using both vwap indications and RSI oscillator (i use 8 for rsi period instead of the common used value of 14). When RSI enters overbought or oversold territory is always safe to close the trade if there is a decent profit on the table, don’t be greedy:)

Price range for today is $928 – $1080 at bitstamp.


Quick Short Term Update: 15 min Chart Bitstamp

chartStrong drop this morning after the China ban on Bitcoin, the market found support with a triple bottom at 840$ then reacted up to the first deviation line of today VWAP, the relative strength index oscillator worked very well giving a nice timing indication for entering and exiting a short term trade.

As long as price stays above today VWAP at 960$ i’m not much concerned for the bearish news impact on bitcoin, instead a drop under today low at 850$ should lead to an important test of my long term support at 700$ (weekly moving average).

Short Term Update: hourly chart at BTCchina

chart

Hourly chart at BTCchina, it is interesting to see that the market behaviour has been bearish all the way down since 1240$ top of yesterday. The volume activity also confirms the short term weakness, bearish volume (second pane in the attached chart). In the third pane there is the total volume, two volume spikes are visible when the market bottomed twice at 950$.

I think that now there could be a short term trade opportunity, for who want to try i recommend to buy now and sell half position at the first resistance , the VWAP at 1055$, and the rest of the position at the first deviation line, around 1150$. Stoploss  should be placed below the double bottom, at around 920$. Also the relative strength index oscillator confirm the trade because it is reversing to the upside from an oversold position.

UPDATE 10 HRS LATER
chart
As you can see the signal worked and now we are at a resistance, the VWAP, and the RSI oscillator is overbought, both price and time indications that advise us to close the position in profit. This is a nice example of the intraday possibility of this market.