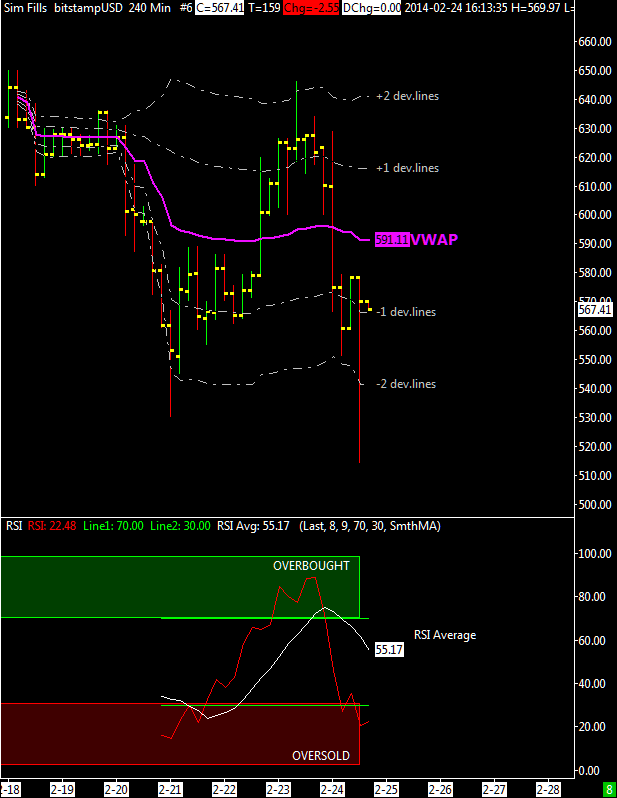
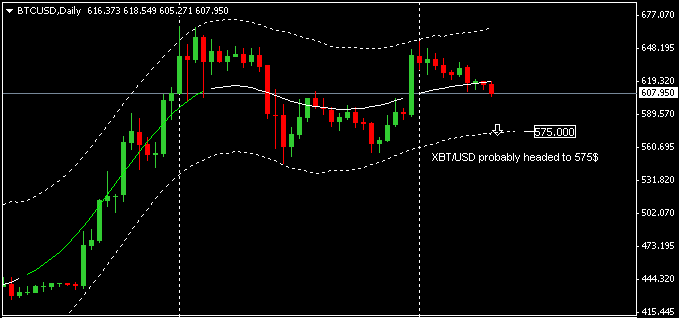
 XBT/USD is slowly retracing back in the lower part of the price channel. This price channel is computed using a fitting function that highly smooth the data and the deviation lines are computed using the average true range, overall it is a bit different from the other approach used by me: VWAP and its deviation lines.
The color of the midpoint channel line represents the slope, white it means the tendency is flat, red and green for a bearish or bullish tendency.
I think that this market is now flat with a short term bearish tendency that should end with a new low at or above $575, any weakness below it and especially below the recent bottom at ~$550 would be bearish IMO.