Long Term Update: Losing steam?

This is a daily chart of 4 main exchanges (bitfinex, bitstamp, btce and btc china data averaged down), the blue tick line is the ALMA moving average. As you can see in the last 2 days the average turned bearish again, this doesn’t mean that XBT/USD will fall for sure, it might be a false signal but considering that also the weekly ALMA turned again bearish failing to confirm the bullish reversal of last week the obvious conclusion is that this market is losing a bit of strength and the risk of a downswing is around the corner. I think that as long as it stays above 360$-365$ is fine despite a negative outlook by those averages but a break to 350$ or lower would confirm the bearishness in the currency pair.

chart

Long Term Update: True Break Out?

After trading in a range that lasted for almost five weeks (300$-380$ price zone), bitcoin prices have made a run for it. The breakout above the ALMA weekly moving average (now at 380$) happened very quickly with high volume. Given the volume action of the last few days, another breakout above the $500 level at a first glance seems likely in the near future. The first decent resistance is the one year VWAP now at around $550 and it’ll be a true test to see if XBT/USD is still in a correction inside a long term bull market.

As i’ve said the weekly moving average i use is turning positive but i need to wait this and the next week to see if the reversal is genuine or not, the risk that we are just seeing a giant bull trap is not excluded; it might happen a repetition of may-june pattern where after an upmove of 250$ the market stalled and resumed the downtrend in July.

For the time being the possibility to reach a long term bottom at $220 by year-end is fading away, at this point i’ve to consider the recent bottom at $275 as an important one and again above the top of the previous cycle did at 266$.

chart

Short Term Update: Trade idea for next 24-48 hrs

Since the early June 2014 high at ~$685, the XBT/USD daily chart has been in a downtrend. By early October, it reached $275 and a move lower towards $220 is not excluded as i said on my previous update. For now a good trade idea could be to buy on the dip around $307 with a take profit at $320; or alternatively go short now with $307 as a target and a stop loss placed just above $335.  Recently I dusted off an old program that uses Elliott Waves Concepts and with a short term analysis i’ve a similar target, $310 and $300. The analysis has been made using minute and minuette as order of degrees; it’s common knowledge that minute or minuette wave degree is intended for few days and hours as investment horizon.
chart

Long Term Update: Weekly Chart

It’s has been a while that i don’t post a long term weekly chart and i think it can help us to better understand where XBT/USD is headed. Price is not going to take off any time soon (it recently moved below the $360 support price i was monitoring in the last days), but more likely to continue its fall towards a new bottom below the 266$ April 2013 top, i expect the bottom to be somewhere near $220 for different reasons.
First, i’ve there at $220 an important deviation line of the 1 year VWAP , second considering actual bitcoin volatility it is very unlikely to move below $200 in the next two months (end of the year), and for “unlikely” i mean a 5% possibility (2 sigma event).
And third, and it is the most interesting, miners production cost for 1 btc ranges from $100 to $200 depending from their hardware amortization expense and running costs, mainly electricity. As bitcoin approaches their production cost value as more miners will feel the pressure and it’s difficult to imagine their reactions but i’m confident that they will avoid to panic sell because they must protect their business at the cost of some temporary losses or missed profits.
If they instead decide to stop the mining farms and to liquidate most of their accumulated bitcoins then it might repeat what we’ve seen in 2011, a severe bear market with dropping network difficulty. Bottom? probably around 80$-100$, a nice 3 sigma event or 1% chance to happen but it is very, very unlikely to happen.
chart

Long Term Update: Shakeout or A Warning of Something Bigger?

Something happened last Sunday around 15:30 GMT however and changed things a bit, an approximate 30$ drop in the XBT/USD in about 5 minutes followed by 60$ rally back up in the late afternoon.  Supposedly this drop had to do probably with a single investor having fun at bitstamp, during the recovery from $275 bottom we have seen a nice 30k bitcoins wall in the order book.  Whatever it was, bitcoin approached very closely the april 2013 bottom at $266 without breaking it.

If Sunday’s lows are broken this week or the next one, then traders should reassess their outlook and give more credence to that sell-off Sunday being a warning sign rather than a shakeout. I can’t not forget that this market is spending a lot of time below my long term averages:

  1. The weekly ALMA moving average i use on the weekly chart, now at $440
  2. The 50 and 200 days moving average i use on the daily chart, respectively at $440 and $520
  3. The 1 year long term VWAP, now stable at $515

As long as it stays below these long term reference levels i can’t be bullish, for this week and the next one this market might rebounce up to the first negative deviation line of the 1 year VWAP, as illustrated below the level is at $370. Once reached this level i expect the drop to resume.
I included also a net volume lecture of btc china exchange, it represents the weekly moving average of the difference between volume made on an uptick less volume made on a downtick thus giving us the buying or selling pressure; pressure that is now positive; at least at btcchina exchange traders are buying at these prices.

I can speculate that the final bottom could be just above $200, why? well the drop started in June is now 18 weeks old and most of the time a price movement doesn’t exceed 25-30 bars or weeks in this case.  Assuming another 8 weeks of falling prices (2 months) as a target i’ve the $200-$220 price area, using in the computation the current level of volatility.

To conclude i think that is very unlikely to see bitcoin going under $200 by the end of the year and before opening a new long term trade i need this market to react enough to turn positive again my weekly moving average.

chart
Chart from Sierra Chart trading platform, Courtesy of Sierrachart, Inc.

Short Term Update

The market has failed a quick recovery above the short term VWAP and as I speculated in my previous update XBT/USD fell and made new lows; staying all the time under the first negative deviation line, as I have already said in the past this is bearish behavior. Short tern resistances at $380 and $400, next supports at $360 and $340. The price zone around $340 could be an interesting one for trying to catch a decent price rebound.
chart

Short Term Update: Again Bearish

Here is a one hour chart of last 3 days, the market has rallied to the first deviation line that acted as resistance; I though this would be easy to pass and attack again the $450 recent top, but the market showed weakness moving again below my short term VWAP and found support at the first negative price deviation line.

I’ve seen a strong buying climax on paypal news when the market topped at $450 and since then it completely retraced down to $400 where the rally to $450 started. This is definitely a bearish behaviour and if XBT/USD fails to quickly recover the $420-$425 price zone i expect to see a further drop to $380 and possibly lower, to new lows.

chart

Quick Short Term Update

XBT/USD reached my forecasted target of $455 and it is now bullish in the very short term (one week horizon). It is normal to retrace back to the VWAP during the recoil phase of the cycle after a strong jump to the second VWAP price deviation line. I expect now a consolidation at or above $415-$420.

chart

Short Term Udpate

Click to enlargeXBT/USD moved above the $405 resistance i’ve mentioned in my previous update, as expected it tested the quick VWAP average at ~$430 without enough energy to break above. This is again a bearish behavior but the bearish pressure is diminishing in intensity, as you can see from the attached chart now it is important for XBT/USD to stay above the indicated support area to prepare a new move to the next target, possibly at $455. If the $455 target is reached then I can start to consider $380 as a candidate mid term bottom.

Short Term Update

XBT/USD continues to fall without ever being able to overcome the first negative deviation line of the average that I use to follow the market in the short term. This is definitely a very bearish behavior, as you can see from the attached chart the first resistance is at $ 406, the next is my VWAP computed using last 7 days, at $ 435.
If the market can move up to $ 435 without going back below $ 405, we can conclude that at least in the short term the bearish pressure is loosening a bit, vice versa if it fails to overcome $405, the first available resistance, I’ve to believe that we will probably see new lows below $ 380. More updated information is available for who follow my IRC channel.
chart

Long Term Update: bearish or not bearish?

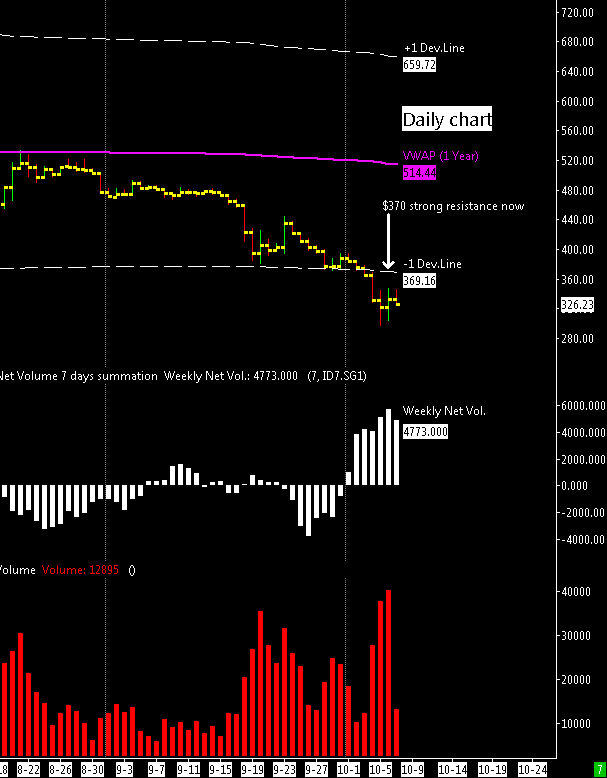
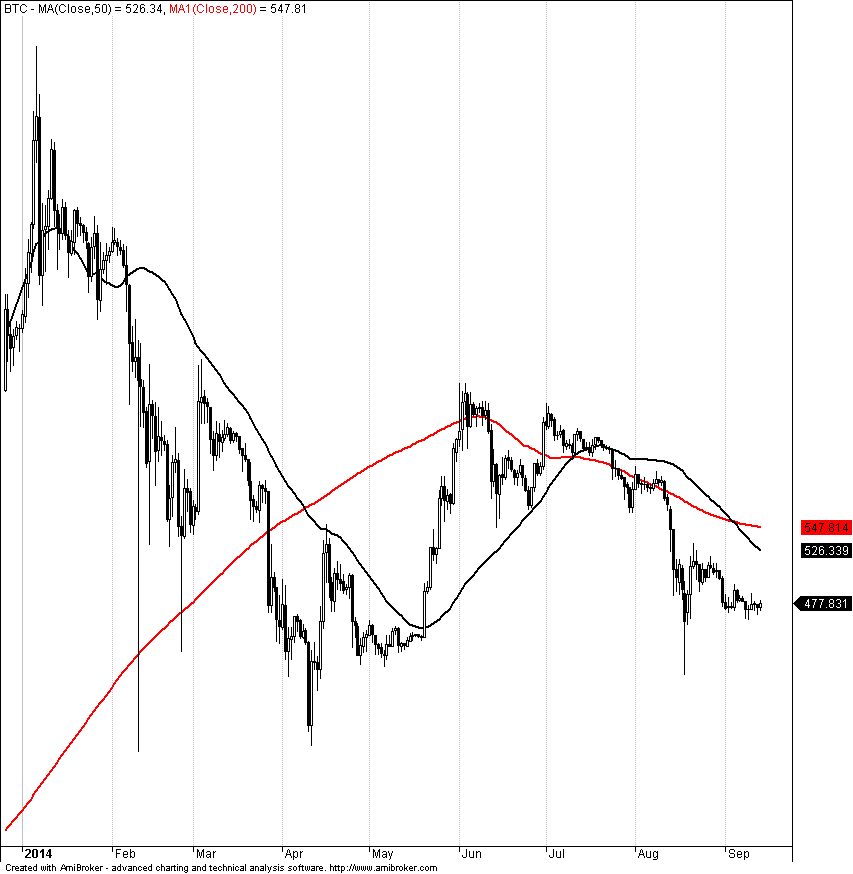
Here is a daily bar chart that sometimes I use to keep track of a bull or bear market trend.

An interesting thing to note about this chart is that XBT/USD is below a dropping 200 days moving average (red line), a typical bear market setup. XBT/USD is also below its 50 days moving average (black line); both averages are dropping confirming the bear market.

Reactions within a bear market typically take a security above its 50 days moving average and up near its 200 days moving average. The 2014 June top is a good example of a reaction ending at the 200 days moving average and above the 50 days average. The position of the 200 days moving average should be considered as the upper limit of a rise within an ongoing bear market.

The first sign that the bear market is over would be a rise of XBT/USD above its 200 day moving average followed by a rally back to or slightly below the 200 day moving average which reaches a sideway or improving 50 days moving average; this configuration for example happened in april-may 2012 at around $5 for then climbing up to $15 in August.
Right now the market appears to be a bit away from this kind of bull market signal but not too much considering that XBT/USD can quickly rise up to or above 550 dollars (200 days average) even in a single day. This quick rise could reverse the 50 days average to the upside and in a couple of weeks reverse also the 200 days average confirming the birth of a new bull trend.

To conclude I think there is a lot of short term bearish sentiment in the market but the bullish news constantly hitting the headlines are increasing the odds of a sudden rise back to the resistances (both averages ranging from 525 to 550 dollars). Still, such a reaction might not be fatal to the bear market trend, so in any case we just have to watch the market’s behavior relative to these moving averages to draw a final conclusion about the bitcoin’s fate. I encourage everyone to add these 2 moving averages to their daily chart.

Many of you are probably asking to themselves if i suddenly turned bearish about this market, yes and no because i consider the 50 and 200 days moving average approach not a perfect one, it might be good for the stock market but for bitcoin that is a new market it might be different, Why? probably because of its insane volatility level that can quickly change the overall picture.

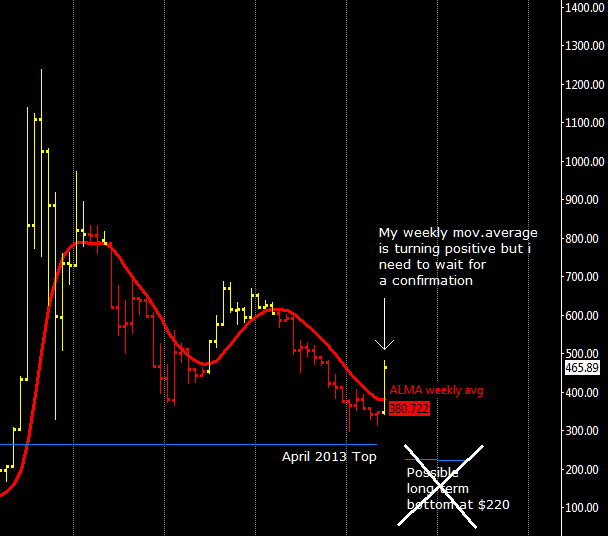
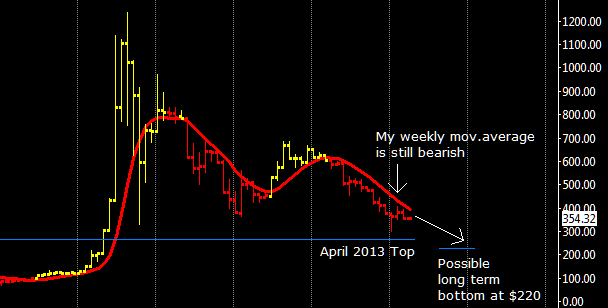
Personally as long as XBT/USD stays above the top of its previous cycle (April 2013 top at $266) and with a rising network difficulty  I’ll never be fully bearish as i’ve already explained many times in the past.

NOTE: The attached below chart is the composite of four main exchanges: btce,bitfinex,btc-china and bitstamp.
chart

Short Term Update

Since my last update this market has bounced twice towards my short term volume average, this happened after the Paypal news about adding bitcoin support. The price zone from $455 to $465 is still working as support, any break below $455 would materialize my bearish scenario down to $420. The current daily cycle is still pointing there, to $420.

Paypal news is just the latest in a long series of positive news for the bitcoin environment but the market hasn’t reacted positively to these bullish news for many months, not to mention the null effect of Dell accepting bitcoins. This is definitely an abnormal behavior and it can only be explained by the low level of those who trade at the main bitcoin exchanges, they lack also of long term view on bitcoin and are here merely for short term speculation.

chart