Long Term Update: again bearish

In my last tweet i’ve said that support is at ~$315 let see in detail why.

chart

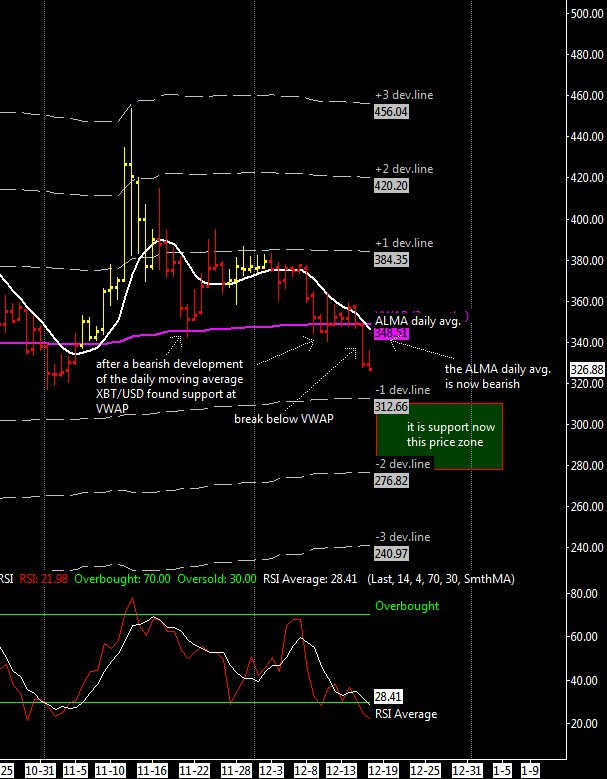
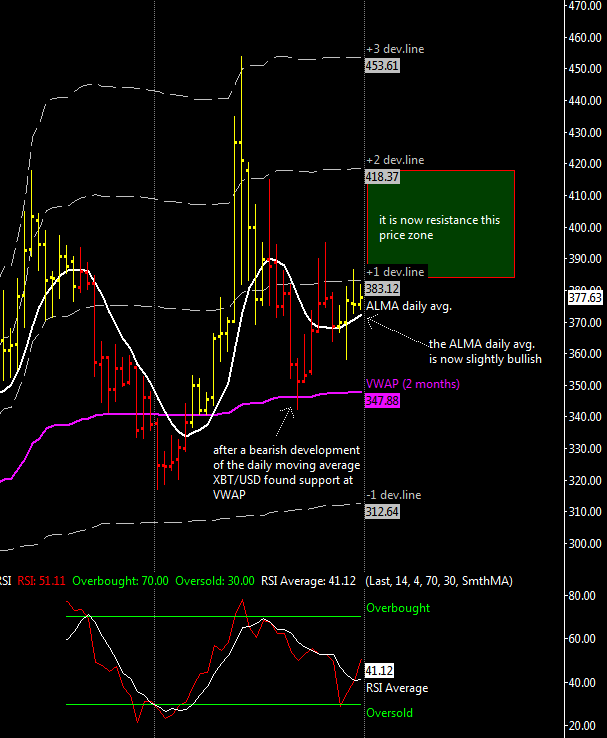
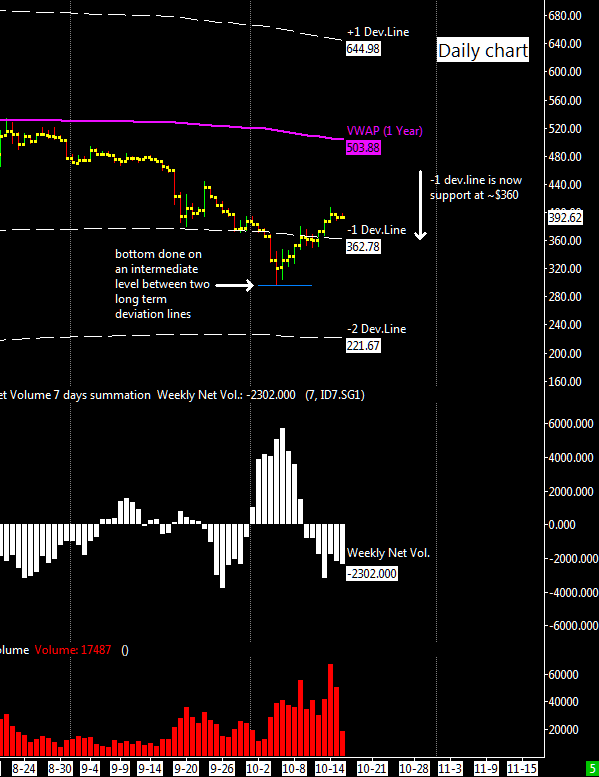
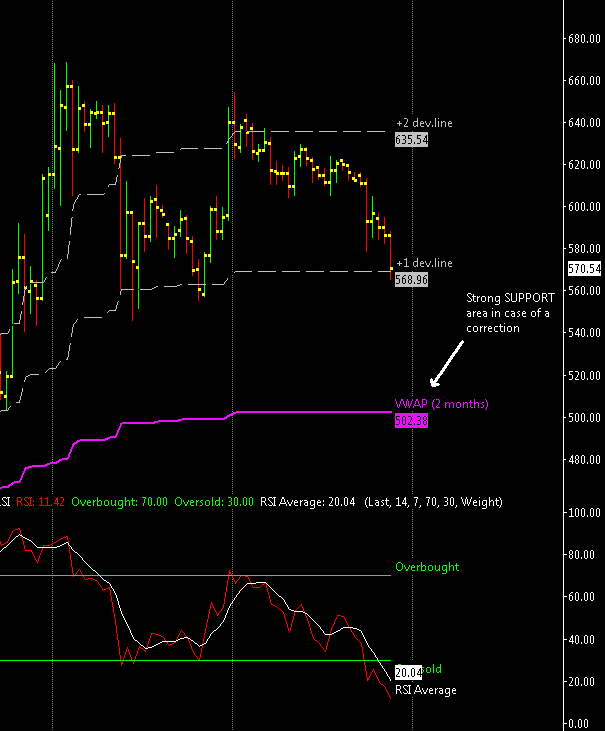
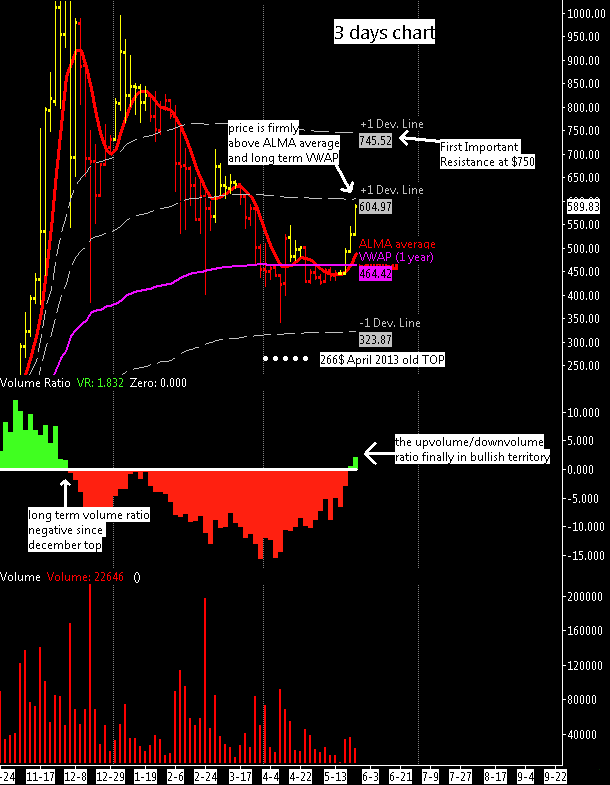
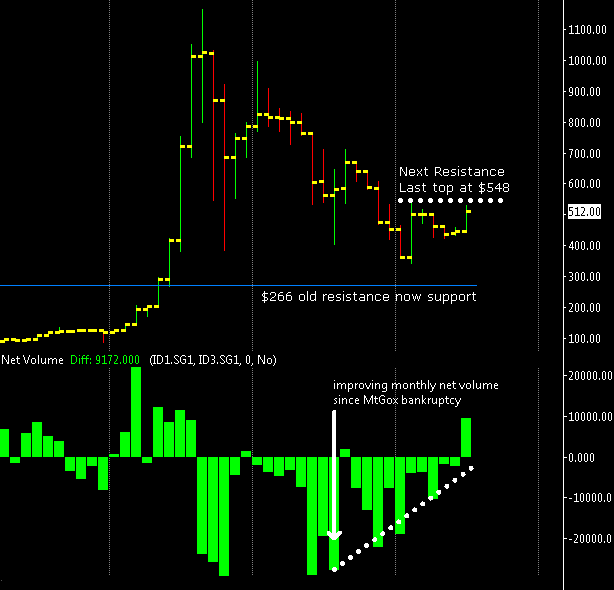
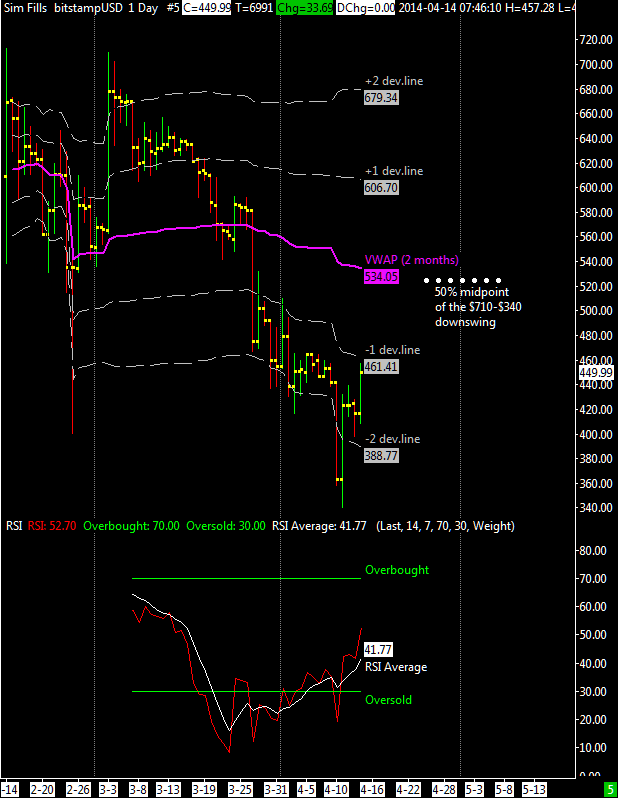
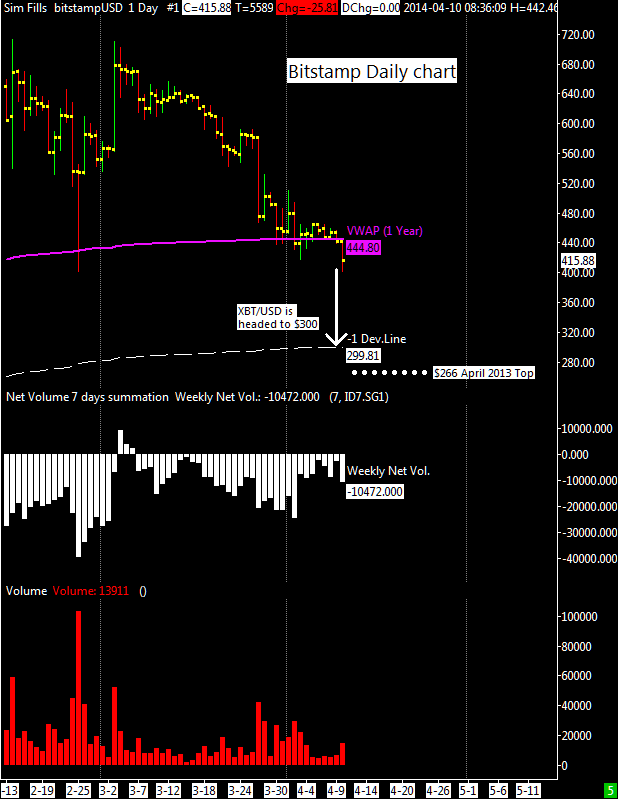
I indicated in the above chart a strong support area for the next 1-2 weeks, XBT/USD is now again bearish because XBT/USD took a peek below the 2 months VWAP support zone at ~350$. I think the market will spend most of its time today and the next days above or at $315 and if it does then the 316$ November low probably ended the drop from 463$ on November 13. Despite the prolonged correction seen in 2014 I see no sign that the very long term bull market has ended (bitcoin is well above the 2013 average price) and in any case I expect the XBT/USD to hold above its previous 2013 top at 266$.

In case of a move below $315 a problematic scenario could develop with the possibility of my old bearish scenario to materialize (a quick visit to 230$ or so). I Expect buyers to show up below 300$ but in this market the volatility is unstable and can increase very rapidly making it difficult to make predictions on where the bottom will be.

Long Term Update

chart

I don’t have much to say since my last update, this market remains confined in a price zone defined by my VWAP (computed using 2 months) and its first deviation line, why? probably because of the bearish indication from the daily ALMA moving average that i pointed out in the previous update (since then XBT/USD failed to make new highs above $400); average that is now slightly bullish after a VWAP test last 21 November at $350.
In the last month we have seen a sequence of three higher lows suggesting an underlying effort to go up with a possible target for December of $420, while support is always around my short term VWAP ($350).

The weekly ALMA moving average is now flat after more then 5 bearish months, it’s an improvement but not enough to confirm a long term reversal, we need patience but at least XBT/USD is trying to build a base for a bullish 2015.

Long Term Update: daily chart

In my previous update I had hypothesized a price movement up to $ 370 instead the market has reached $ 415, showing more strength than expected, a sign that investors are looking bitcoin as underpriced.
In the chart that I attached below you can see the potential levels for the next few weeks and months; the recent $275 bottom corresponds to an intermediate level between two long term deviation lines, the first line of deviation that is at $ 360 is now become support and is no longer a resistance as previously thought. I believe that in the next days the market will stay above $ 360, once complete this consolidation phase we will see the true intentions of the market: to return below 360 dollars with strong volumes indicating a possible scenario of a new low at around $220; on the contrary, a break through the 430-440 dollars resistance level (an intermediate level between $360 and the vwap at $500) would mean a retest up to the long-term average VWAP, now just above $ 500.

It will be very important to observe what the market will do at around $ 360 because below this level it would be again fully bearish. I conclude spending two words about volume activity, my weekly net volume indicator is again bearish for this particular exchange (btc china), but also for the others ones (bitstamp, bitfinex, etc..) signalling a potential topping area for this market, at least for the short term.

chart

Long Term Update: At Support

chartI attached here on the left a long term chart where each bar represents one day of market activity.
XBT/USD is fully in a short term corrective phase inside a long term bull market because the price recently has been above my one year vwap, now at $530.

I think that if there will not be an increase in volatility it is unlikely that we will see a drop below the VWAP, instead if a small flash crash will develop this month the support could be at about $450 (in between the VWAP and the first negative deviation line now at ~$373)

At this point if I see in the coming days the volume turning positive (it is also a sign of a recovery),  I might decide to increase my bullish position.

(Price Data used in the chart is an average of several exchanges)

Long Term Update

chartThe trading range has been broken to the downside, at this point it is better to check my 2 months VWAP to see where are decent supports.
We have ~$570 and the VWAP itself at $500. At the moment the price is floating around the first positive deviation line ($570) i’m not sure if it can react from here or not despite the fact that the daily RSI is very oversold, but if during August there will be a drop down to $500 i’ll probably increase my position.

With the recent level of volatility (relatively low) a drop to $500 is possible and i think that there are many investors out there ready to buy at a cheaper price, at or below five hundreds dollars.

To conclude, we are seeing a physiological drop, totally unrelated to good/bad news; it is only an issue of supply and demand trying to find a new equilibrium point; once reached a new bottom is established and this market will be ready to move up again.

Quick Update: Daily Chart

chartThere was not enough volatility to reach $ 530, XBT / USD stopped at $555, the middle level between 530 and 580 dollars (the midpoint of the price channel).

I believe that bitcoins will remain within these extremes of the price channel between 530 and 630 dollars with the nearest resistance located at about 610 dollars. The oscillator volumes is still negative and could become positive with a strong break of $ 630.

Long Term Update: Daily Chart

chartI think that this market is still in a phase of moderate correction, not severe at all. Support for this week is at $ 575, in case of break of that support this market could reach the bottom of the price channel that I have shown in the attached graph, at around $ 530 which is the price level of strong support that I indicated in my last tweet.

I include with this chart (btce prices using metatrader 4) a proprietary volume oscillator that i developed and it is very powerful in spotting trend reversal, at the moment it is bearish.

I say again that it is important to stay above $520 for the long term, any weakness below that price level would have bearish implications for the long term although I can accept a quick spike below that price level but  it must be temporary and not for a prolonged period of time.

Long Term Update: Daily chart

chartThe long-term outlook of XBT/USD is still positive and a move to $750 appears likely. However bitcoin entered again in a congestion phase, a short-term correction might develop from here with a drop to the support zone at $517-$592 price range.
I remain confident that a short term bottom should develop above $580.

RSI oscillator is giving a sell signal but it is not accompanied by high volume so i’ve decided to ignore it for the moment. The net volume is positive on the 3 day chart (not included here) and not yet indicating a strong sell activity.

Strong support for the mid-long term is the 2 months VWAP at $517 @bitfinex and $508 @bitstamp.

Long Term Update: 3 days chart

chartI’ve decided to buy after a strong breakout of the previous intemediate $548 top. I report here the 3 days chart with the up/down volume ratio finally bullish after more then five months of bearishness, I think this is a very bullish signal for the long term. It is pretty obvious that for a better confirmation we need to move above the $710 top of March ’14.

Looking again the one year VWAP and its deviation lines i think that the next important resistance area will be at $750 where probably sellers will show up again. Now XBT/USD is near the first positive deviation line but i think there is enough fuel to move above $600, in any case there could be a break of $50 from here down to $520-$530 where i’ll probably open a second trade averaging down my position.

Averaging down a position it is often considered a bad mistake but i’ve a different opinion. In books and information about trading all say the same things, that you should never averaging down a losing position, etc… Well they strongly emphasize that money management is a key aspect , they always tell you that it is dumb to average down, to always use stop losses, risk 3% of your account and so on,  it is something like a never ending recycling of bad ideas used by the retail traders that produces the illusion of certainty.

Because 95% of traders always fail you have no choice to do exactly the opposite to succeed ; under some circumstances, averaging down can help you to mitigate the uncertainty of market speculation and allow volatility to produce profits for you without the need to be a guru in divination.

Long Term Update: Long term Buy? not yet

chartThis is a weekly chart (bitstamp data) since August ’13, it is important to analyze the weekly chart and the net volume , weekly charts have much less noise and if you are using the daily and weekly charts for your trading, always look at the weekly first.
Here this chart is telling us that this market is slowing down its fall, the net volume activity peaked during the MtGox crysis and the subsequent bankruptcy in late february. Since then the net volume slowly started to improve and the selling activity was already diminished when this market bottomed out at $340, first divergence to note.

Now with the recent move to $520 the net volume is in positive territory but i think that it is not enough to put an end to a very long price correction of 5-6 months; the risks of a classic pump and dump move is high, because i think that the recent 15% surge in prices has probably been orchestrated by a single big investor.
Before opening a long term trade i’d like to see at least 2 weeks of consecutive positive volume activity and XBT/USD moving above previous top of $548.

Note to readers: As usual I’m open to your comments.

LongTerm Update: daily chart @bitstamp

chartThe market reacted from the recent low of $ 340 , because of this I think it is better to look more closely at the VWAP calculated with two months of data instead of a year, why? Well because long term VWAP is no longer functioning as a support , for this reason we will put it aside for a while.
After a prolonged decline , from 710 to 340 dollars, where the market has lost almost 50% , I believe that a rebound in prices is due and it should reach the mid-point of this bearish swing up to about $ 525 .
It is not a coincidence that at $ 535 there is the average VWAP now calculated with two months of data, consequently i think that up to $ 530 would be a normal rebound in a bearish market phase.
The RSI oscillator is recovering and when the market will reach the $ 530 price level probably the oscillator will be in the overbought zone , this could lead the market to stay lateral around the resistance to subsequently resume to fall.
In any case the volume has the highest priority above these analyses based on the VWAP and its price levels , as well as the RSI oscillator; if you begin to see a positive ratio between volumes made on uptick and downtick  then it will probably be the confirmation that a new uptrend has started, regardless of what price levels and oscillators tell us if buyers come back it is imperative to follow them.

To conclude, if i finally see a positive volume ratio (computed as usual on the 3 days chart) and a market moving above $530 i’ll open a long term trade, initially with half position and then moving to full position once i see on the 3 days chart my ALMA moving average turning positive. The stoploss will be tight because the final confirmation of a long term reversal there will be once the market will move above last top, located at $710.

Long Term Update: next stop $300

chartXBT/USD is making further downside progress below the 1-year VWAP and at this point i think that the breakout is confirmed, a move should follow towards the old April 2013 Top at $266.
I think that at $300 there will be a strong support because of the first negative deviation line of the VWAP and to reach this level, looking the bitstamp order book, we need approximately 15k bitcoins.
Adding this value to the current weekly net volume we have -25k bitcoins, a value that looking the past should provide support to the price action, a rebounce should follow from $300.

To conclude, now we are at the baseline of the giant descending triangle and it looks ominous.  It can break either way but usually downwards (70%-80% of the time) as i said in my previous update.