Offtopic: Cacoethes scribendi

“Cacoethes scribendi” or translated from Latin to english “a burning desire to write”, writing always of bitcoin sometimes is boring, today i show you the template i use with metatrader 4 applied to other assets like stocks, indexes and altcoin.

I already explained that an idea that i like is to do a price regression of our asset using a filter that eliminates all cycles below 30-40 periods with the intent to extract the underlying long term trend, then you can try to earn some money trading the secondary cycles that move the price up and down inside the price channel.

SP500/N100 weekly chart

sp500

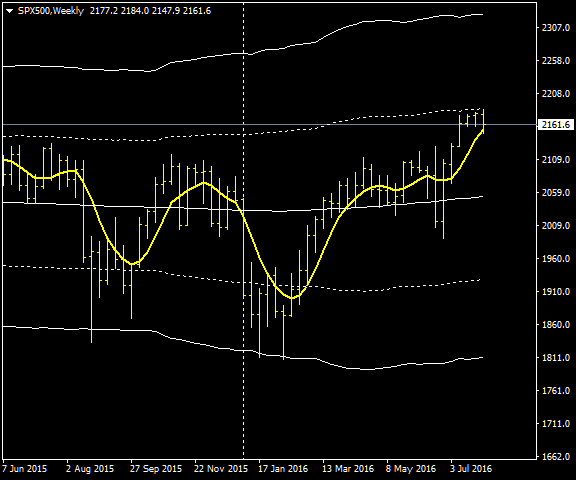
Mid channel line color is white thus this market is neutral the ideal situation to trade the price levels, at the moment there could be a short opportunity, stoploss above the dotted positive deviation line.

n100

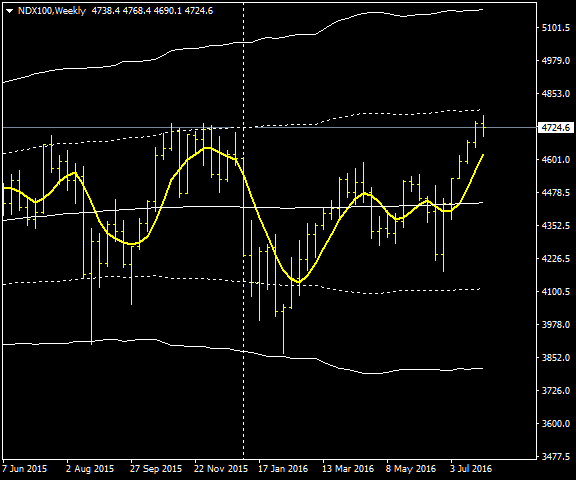
Similar situation for the nasdaq 100 index.

GBPUSD

gbpusd

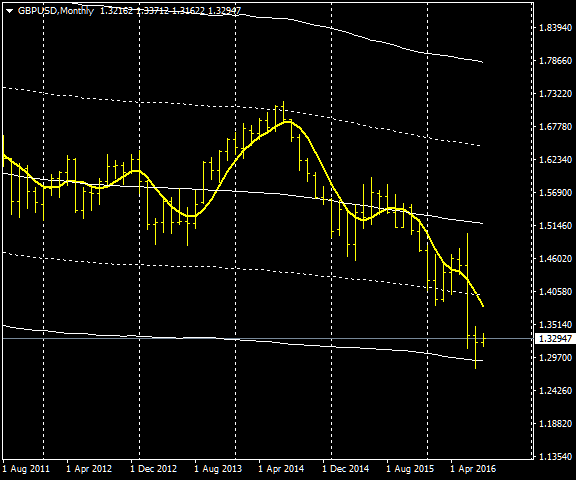
The big drop of the Brexit is clearly visible, the pound should stay above 1.29, it’s the moment to buy with a stoploss below 1.28

Nikkei 225

nikkei225

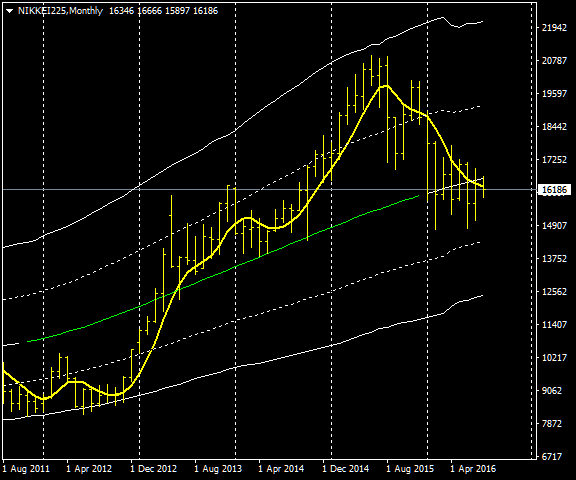
Nikkei is short for Japan’s Nikkei 225 Stock Average, it is a price-weighted index comprised of Japan’s top 225 blue-chip companies traded on the Tokyo Stock Exchange. The Nikkei is equivalent to the Dow Jones Industrial Average Index in the United States.
In this mothky chart is visibile the big rise fueled by the quantitative easing of the Japan Central Bank and the subsequent drop after flirting with the resistance at 21000.
At the moment it is holding above the first negative deviation line, i don’t see any trading opportunity.

Tesla

tesla.png

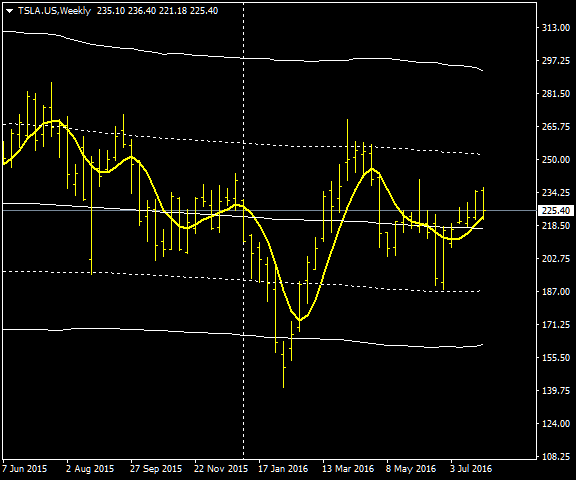
On the weekly chart the tendency is neutral, midline color is white, ideal to trade secondary cycles like the one that pushed down Tesla below 150 usd and below our support, a very good trading opportunity, it is possible also to trade the dotted levels but they are less safe.

Ferrari

ferrari

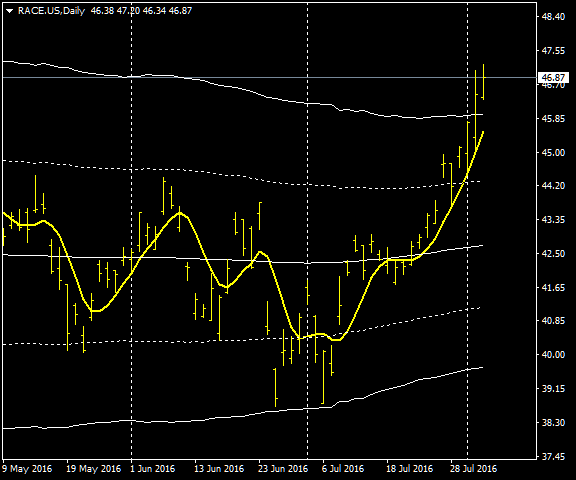
Daily chart of ferrari (RACE ticker), after an interesting double bottom on the support this stock trended higher above the resistance after the earnings.
I think we are seeing a buying climax and in this situations is smart to sell the good news, i see a short trade opportunity here but it’s wise to wait some weak signals from this stock before going on.

Nintendo and the Pokemon Go Bubble

nintendo

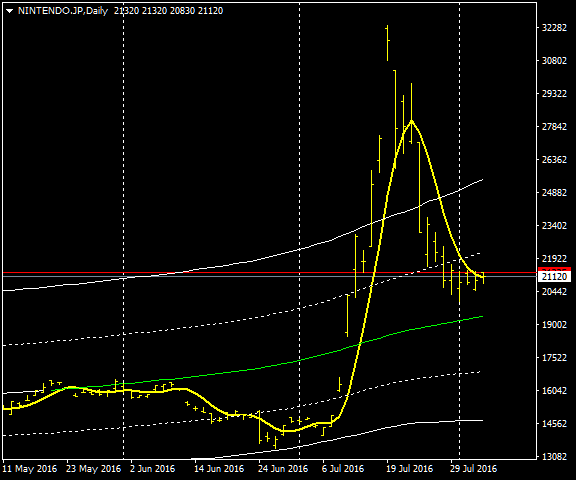
No comment here, the bubble is evident but this stock is still hovering above midline and the long term trend is bullish. Again a nice double bottom at the support.

Apple

aapl

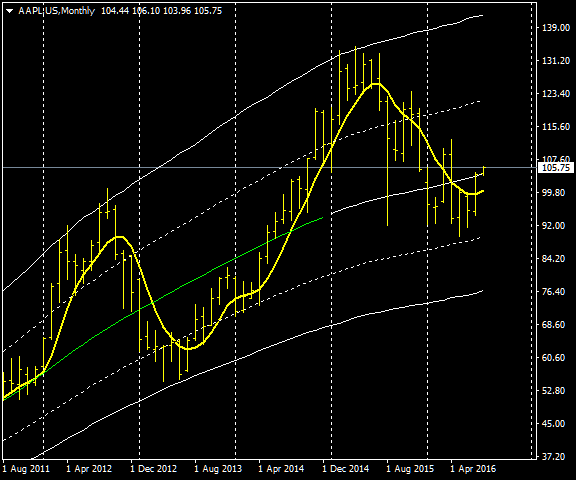
Last five years of Apple in this monthly chart, here the support levels worked almost perfectly. Apple is losing some steam as the midline color is white, neutral long term tendency despite you can see a sequence of higher highs and lows. The stock reacted from the dotted line at around 90 usd but i’m not sure is going up yet, the trading opportunity here is a test at 75-80 usd this year or the next one.

ETCUSD – Hourly chart

etcusd

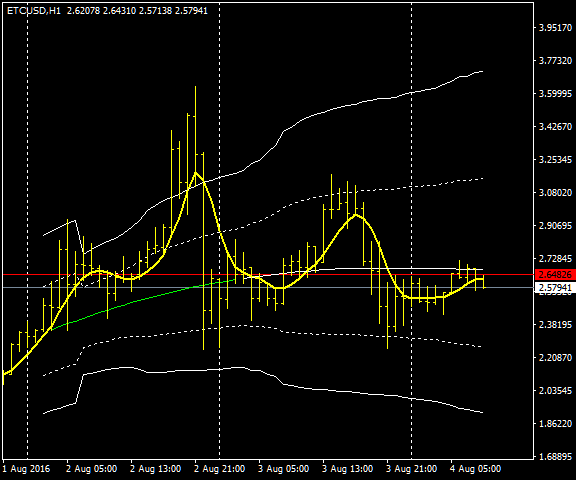
Hourly chart of ethereum classic, again bubbles are clearly visible. Some congestion outside the upper solid deviation line it’s the warning signal, be prepared to open a short. Now volatility is a bit lower and this altcoin is moving inside the dotted deviation lines. I see a buying opportunity once 1.85 usd is tested.

Conclusions

This price channel indicator is an improvement of the classic bollinger bands indicator, what i don’t like of the bollinger bands is the wrong way to compute the upper and lower bands that might lead to very misleading values sometimes as i explained at the end of this old article. To keep things simple i omitted to include some timing indicators, for example adding the Walter Bressert DSS oscillator with ethereum classic we have:

etcusd+dss

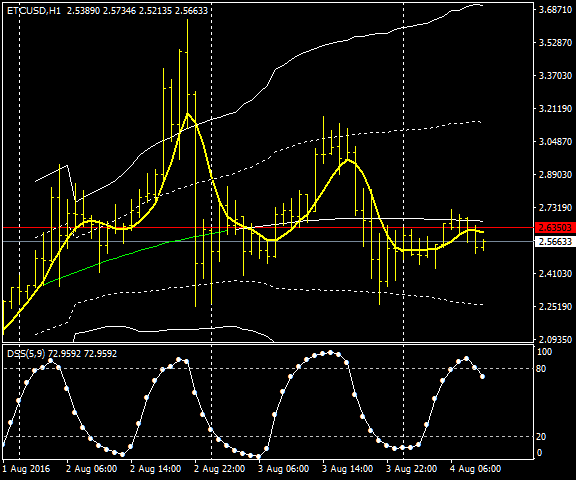
Clean cycles togheter with a correct approach to spot support/resistance levels and you have a decent guide to follow. This oscillator is configured using 9 periods and 5 periods for a second pass smoothing.


Long Term Update

This is a template i use with metatrader 4 where you can see a price regression channel. Yellow line is the same average i use on sierrachart, ALMA moving average.

weekly
Weekly Chart since October 2013

The dotted deviation lines are calculated using the volatility derived from the average true range indicator. The solid deviation lines are calculated with the same approach but using two times the value of the average true range. Most of the time XBTUSD stays inside the dotted deviation lines but during period of high volatility it moves towards the solid deviation lines as happened in the last Top of June at $780.

With the bitfinex flash crash XBTUSD tested the first lower deviation line at $475 although on some exchanges the bottom touched $460. I don’t think is over yet, there might be a secondary reaction that can last all this month and maybe part of September with a test of the lower deviation line, this price level is near $400 as indicated in the chart.

The color of the mid-channel line represents the strength of the trend, red if bearish, white for neutral and green if bullish, at the moment the main trend is bullish and it’ll not change if XBTUSD doesn’t move below $400 for a prolonged period of time. I’m not going to liquidate my position as soon XBTUSD stays inside this long term bullish price channel.

As usual this article is available also at steemit.

Long Term update: Static Resistance

Monthly Chart

monthly

This is a simple monthly chart since Jan.2012, important facts are:

  • Accumulation zone #2 is above previous one, #1 in the chart
  • The static resistance at $680 is also the 50% of the price swing from the all time high down to the 2015 bottom at ~$150

As i explained in past updates the midpoint or 50% it is one of the strongest and most important resistance/support level. The main trend is obviously up (at least so far) because the low around point 2 in the chart is above point 1 thus is legit to expect a new all time high if this market can break above the $680 static resistance.

Furthermore the fact that the two accumulation zones highlighted in the chart never overlap tell us that the underline long term trend is very strong and because of this i expect a new all time high in case of a strong breakout above $680.

Forecasting resistances

btcusd-mn1-simplefx-ltd

This is a template i use for long term analysis with metatrader 4 platform, first i compute a price regression with 12 or 24 bars/months with a monthly chart then i compute supports and resistances. Dotted lines represents supports/resistances using the recent volatility of XBTUSD, non-dotted lines are levels computed using twice the value of recent bitcoin volatility.

We are exactly at the resistance and this is very interesting because in 1-2 months we will see if bitcoin long term trend is still up or not.

I have taken in account the log-normal distribution of price otherwise i’d have had very bad results in computing the levels, usually it is not required but when prices movements are so high you have to. What does it mean? It’s simple, before doing any calculation first compute the natural log of the price, do your stuff and last reexponentiate the data to have back the price chart with a linear scale.
This is why i do not recommend to use standard bollinger bands with bitcoin on a long term chart, you would have bad results, sometimes with the lower bollinger band going negative! clearly unrealistic.


Volatility is back and in the right direction

XBTUSD touched my weekly resistance at around $480, i think this resistance is temporary and considering the huge amount of volatility increase there are chance to see higher prices ahead. It’s time to switch to a weekly chart to better understand where is the first decent resistance .

chart-xbtusd-weekly

Above you can see a weekly chart of XBTUSD using an average of 5 exchanges. I plotted the bollinger bands and highlighted 3 breakout bars on point 1,3,4.

XBTUSD did a first breakout bar above the upper bollinger band on mid July 2015 (point 1 on the chart) but immediately turned back inside the bar, typical bearish pattern. At this point a bearish reaction started and ended at the lower bollinger band (point 2 on the chart) .
From here the true movement started with a clean breakout bar (Nov. 2015 point 3 on the chart).

Now we are seeing the same breakout bar (point 4 on the chart) but i can’t say yet if it is a legit or a fake one. Judging from what happened since Jan of this year with XBTUSD doing a long sequence of higher lows i’m tempted to say that this market is strong and probably it will break above 500 dollars; the next 1-2 weeks are crucial to see if this breakout is valid or not.

In january i was telling you that a good resistance for the whole year was $760 and it is still valid, there is 1% possibility to move above $760, 5% to go above $630 and 30% to pass $550. In case of a strong move above $500 the possible targets are these.

Long Term Update: weekly chart

XBTUSD is basically flat and my support/resistance price levels are unchanged (currently $375-$430) although price tends slightly lower after a failed attempt to break above $420 last week.

BTCUSD Weekly

This is the same template i proposed in the last update with just a shorter period used for the average and its deviation lines. The Osma indicator is still slightly weak, also the 2 months VWAP is at $405 and flat.

In this situation the best strategy, for a short term trader, is to trade the deviation lines without relying too much on timing indicators or in simple words just buy the supports and sell the resistances.

I was expecting a stronger up swing but XBTUSD entered a sideways movement that to end requires a breakout somewhere above $430 or below $375. I’m reading many bitcoin traders analysis, most of them bearish because of the block size issue but at the moment i prefer to remain neutral about it.

Long Term Update

I decided to average down my position because XBTUSD is moving up from the newly formed higher low and this is the confirm that a new uptrend has begun. I was expecting a low in the $290-$300 price zone but bitcoin did the bottom at around $360 after the Mike Hearn news of mid January. This is very bullish IMO, a strong higher low despite a bad news and concerns about the blocksize debate.

I attach here a template i use for a weekly chart, the platform is Metatrader 4. As you can see I’ve drawn a long term price channel starting from an interpolation of current uptrend (green line) and deviation lines based on the average true range, another way to measure volatility. Extrapolating current weekly upswing i think the maximum target should be around $600 by the end of march. In the lower pane of the chart there is an interesting oscillator, OSMA, now moving to bullish territory.

If i’m wrong then this market will fail to establish a new higher high and will probably move down to the first negative line at around $290-$300, an important support area.

BTCUSDWeekly

Long Term Update: 2016 Outlook with entropic methods

Chek this post of one year ago for a brief explanation of the theory beyond this forecast. This year I propose again the same analysis and it will be a main guide about support and resistance levels for all 2016.

Updated values for bitcoin (in brackets values of last year)

 BTC/USD
Growth Factor G 1.000166 (1.000553)
Shannon Probability P 0.515 (0.518)
Root mean square RMS (or volatility factor) 0.053 (0.056)

More or less bitcoin’s entropic values dropped a bit, with less volatility and a smaller value for the growth now 0.000166% compounded daily or 6% yearly growth down from 22% of 1y ago.

 2016 Price forecast  Full volatility  Half volatility
Forecast using only G* 458$ 458$
Upper bound adding volatility 1257$ 760$
Lower bound subtracting volatility 167$ 277$

*458 is obtained with today price (432$) times (1.000166^365)=1.06
432*1.06=458, just change 365 with the number of days you prefer for a different forecast.
For a more aggressive forecast you can use 1.001742 instead of 1.000166, this bigger value for growth doesn’t consider measurement error due to the short dataset I used, only 1145 days of historical data. Use this bigger value at your own risk:)

Conclusions

As usual i recommend to consider the support/resistance levels obtained with a halved volatility value thus for 2016 btc has an high probability to stay inside the $277-$760 price zone with a strong support at around $170 in case of panic selling.
At the same time i think that at the end of a strong buying climax period it’ll be hard to see btc price above 1250$ and very unlikely if not impossible to see it at or above 3400$ (using twice the value of historical volatility).

Long Term Update: new upside breakout is at hand

In my previous update i was expecting a top around $400; “…….. i think that a final top might happen at or below $400 before a strong correction will take place……..”, i’ve been wrong and XBTUSD topped at $500 with an impressive lecture of the Chaikin volatility indicator, see chart below (click to enlarge).

chaikin
At the moment the volatility indicator is below zero despite the recent price spike to ~$370 that i consider resistance for this week ($360-$390 price zone).  The forecast i’ve done in January is still valid and i think that without an insane volatility level it’ll be hard for the next top to be above $650-$700 before year end.
As usual i’m open to comments here and also in my irc channel.

Long Term Update: at resistance?

From my previous update: “..About the recent prolonged period of low volatility i’m observing an increased volume activity among all the biggest bitcoin exchanges, this let me think that bitcoin is probably accumulating to later break the trading range and move above $250. This break would be confirmed with a positive reading of the Chaikin Indicator..”

Well at the end it happened and a volatility increase in the right direction moved XBTUSD above the trading range ($210-$245), it is interesting to observe that a very strong volatility peak happened on October 22 but instead of topping this market continued to push upward (observe below chart),
chart
at this point i think that an intermediate top might happen with a second volatility peak probably within November 10th.

At resistance?

Checking price levels it seems that it’ll be hard to pass $320-$330, the 1Year Vwap is at $264 and the 2nd positive deviation line stands at $323, only %5 chance to move above in the short term despite this i think that a final top might happen at or below $400 before a strong correction will take place. If i’m wrong a strong support lies between the VWAP and $280 (where it happened the first volatility peak).
bitstampUSD 3 Day #1 2015-10-29 17_33_14.988

If you want to support this blog you can open an account at bit4x using my referral link, clicking here . Thank you.

Long Term Update

Two months ago in my previous update i was skeptic to see a bullish reaction and i was almost convinced of a drop to $210 and lower instead XBT/USD choosed to avoid my bearish scenario of sub $200 prices.

What could this mean? Well i think that the drop from the 2013 all time top is over and this market just entered in a prolonged sideways move where it appears to withstand the high selling pressure that has characterized the correction since the all time top; this long term accumulation should resolve in a big upward movement later this year or at max in the first part of 2016.

What i’d like to see now is a smoother move above $300 rather then a violent price spike that most of the time resolve itself in a further drop. A constant rise will also allow my long term moving average to finally turn bullish and convince me to average down my long term position of June 2014.

To invalidate my new bullish bias XBT/USD have to move below $210 this summer.

Long Term Update

I waited a while before publishing a new update after the crash to $165 to see if market would have stabilized over $ 200. Now XBT/USD do seem to have a bullish bias and it has traded up from oversold levels but there is too much risk to go against the short term bearish trend. Despite this risk i decided to open a short-term trade (2 long positions opened at $230 and $170) that i’ll probably close at $270 where i’ve the first decent resistance level.
Before thinking about any bullish longterm safe bets i need to see my long term moving average turning bullish again, at the moment it is at around $300 and firmly bearish.

In the below attached chart I have highlighted the important levels for this year that i’ve spoken about in the previous update,these levels are still valid and i think that any visit below $220 and above $130 represent a long term buying opportunity. It would be a perfect longterm buying signal to see this year my long term moving average turning up with the price still below $220.

chart

Long Term Update: 2015 Outlook with entropic methods

With the smell of fireworks still lingering in the air i computed the 2015 outlook with entropic methods used in modern finance. The concept of entropic analysis of equity prices is old and it was first proposed by Louis Bachelier in his “theory of speculation”, this thesis anticipated many of the mathematical discoveries made later by Wiener and Markov underlying the importance of these ideas in today’s financial markets. Then in the mid 1940’s we have had the information theory developed by Claude Shannon , theory that is applicable to the analysis and optimization of speculative endeavors and it is exactly what i’ve done just applied to bitcoin/usd ratio, especially using the Shannon Probability or entropy that in terms of information theory, entropy is considered to be a measure of the uncertainty in a message.
To put it intuitively, suppose p=0, at this probability, the event is certain never to occur, and so there is no uncertainty at all, leading to an entropy of 0; at the same time if p=1 the result is again certain, so the entropy is 0 here as well. When p=1/2 or 0.50 the uncertainty is at a maximum or basically there is no information and only noise.

Applying this entropy concept to an equity like a stock or a commodity or even bitcoin itself common values for P are 0.52 that can be interpreted as a slightly persistence or tendency to go up, this means that for example stock markets aren’t totally random and up to some extend they are exploitable, same for btc.
Knowing the entropy level of bitcoin/usd is crucial if we want to compute its main quantitative characteristics, as i explained in the technical background of my blog this process is quickly doable once you have all the formulas.

 BTC/USD  US Stock Market  Gold
Growth Factor G 1.000553 1.000198 1.000120
Shannon Probability P 0.518 0.510 0.508
Root mean square RMS (or volatility factor) 0.056 0.022 0.009

As comparison i included in the above table a commodity and the american stock market, you can quickly see that bitcoin is much better then them in terms of growth, also the entropy is lower (because P is higher) the only negative aspect is the volatility that is much higher nevertheless the growth factor of btc/usd remains pretty high and once volatility decreases it will improve even more.
At this point with those quantitative parameters we can quickly compute a price forecast for 2015 just taking the growth factor G to the power of 365 (365 samples for 1y) and multiplying it for the initial price, at the moment is 315$, so we have:

Target price for 2015 = price * G^365 = 315*1.000553^365=383$ or 26% expected growth, but because of a rampant volatility there will be for sure strong price  fluctuations above and/or below 383$.

 2015 Price forecast  Full volatility  Half volatility
Forecast using only G 383$ 383$
Upper bound adding volatility 1136$ 660$
Lower bound subtracting volatility 130$ 220$

I included in the table also a forecast using an halved value for volatility, it is interesting to see that with reduced volatility i don’t expect to see prices below 220$, a well know support value for who follow regularly my blog and chat, I expect from buyers a strong buying activity in the low 200$ for all 2015 if the opportunity arise.

The price target in case of a new bubble is unchanged and it is the same i was forecasting last year, roughly 3300$ but don’t get excited too quickly:) there is only a chance of 5% to go there in 2015.

As usual i’m available to questions if more explanations are needed or if you want to obtain more details of these computations (formulas used etc..).