Every year i post an outlook using entropic methods explained in the technical section of this blog. Here you can find the 2015, 2016, 2017, 2018, 2019, 2020, 2021, 2022, 2023, 2024 and 2025 forecast update, where you can find more information about this approach.
Updated values for bitcoin (in brackets values of 2025) using daily data since August 2010 (from now on I will use only BITSTAMP data, as today there are not many differences between major Bitcoin exchanges.).
| BTC/USD | |
| Growth Factor G | 1.00094 (1.00099 ) |
| Shannon Probability P (see this as entropy) | 0.5217 (0.5295 ) |
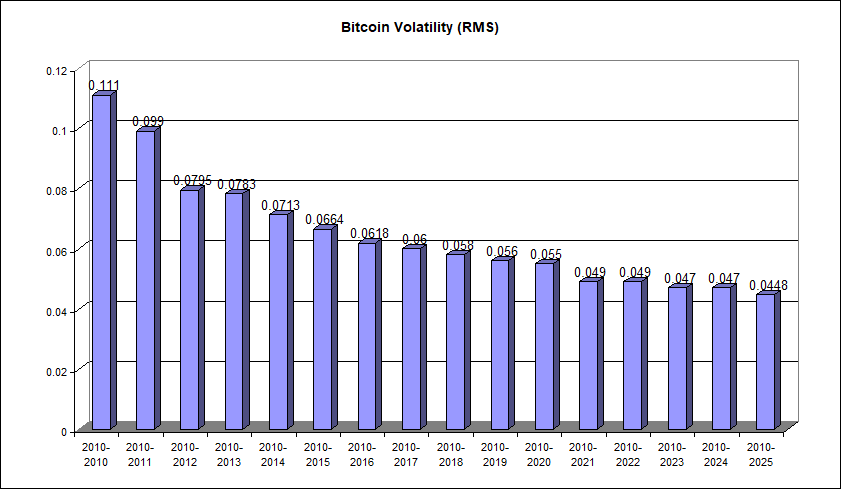
| Root mean square RMS (see this as volatility) | 0.045 (0.047) |
The entropy levels of Bitcoin against the USD showed no improvement in 2025. The Growth Factor (G) dropped a bit to 1.00094% daily compounded, equivalent to about 41% annually. The optimal portion of your total wealth to allocate to Bitcoin is now 4.3% (~0.5217*2=1.0434 – 1 = 0.0434 or ~4%) and it went down a bit due to a flat year.
“For those who may have forgotten, the Shannon Probability measures the persistence of Bitcoin’s price movement, indicating the likelihood that the asset will experience a positive trend. A value of 0.52 suggests that, out of 100 days, Bitcoin is likely to show an upward movement on 52 days, and either a decline or no significant movement on the remaining 48 days.”
Bitcoin’s historical volatility dropped slightly this year, the only positive development amid otherwise challenging data, and aligns with expectations for a maturing asset in terms of capitalization. However, as noted in updates over the past two years, the pace of decline has slowed considerably, and volatility remains substantially higher than that of other assets, underscoring Bitcoin’s persistent nature as a highly speculative investment.
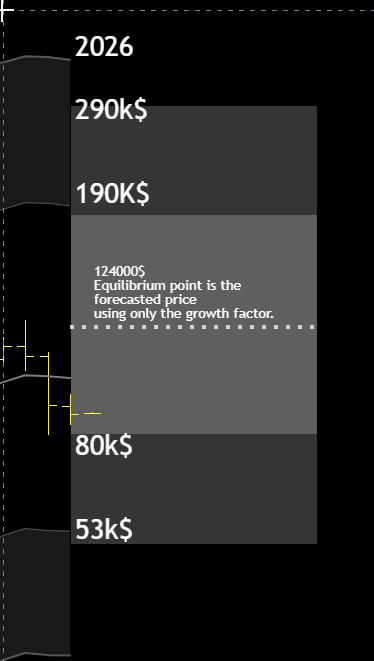
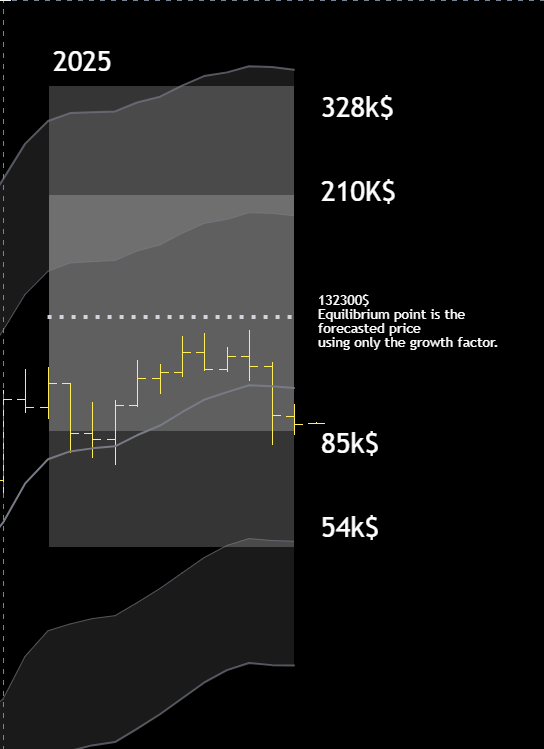
| 2026 Price forecast | Full Historical Volatility | Half Historical Volatility |
| Forecast using only G* or Growth Factor | ~124,000$ | ~124,000$ |
| Upper bound adding volatility | ~292,000$ | ~190,500$ |
| Lower bound subtracting volatility | ~52,700$ | ~80,800$ |
*124,100 $ is obtained with 1st January as a starting price (around 87890$) times (1.00094^365)=~1.41 | 87890*1.41=~124000$, just change 365 with the number of days you prefer for a different forecast.
What happened in 2025?
Conclusions
After holding my long position for nearly three years, initiated in February 2023 at approximately $22,500, this is a good moment to reassess the risk/reward profile at current levels.
The 2025 data tells a nuanced story, while Bitcoin delivered positive returns, the entropic indicators showed marginal deterioration. The Growth Factor declined and Shannon Probability dropped , these aren’t alarm signals, but they suggest that the statistical edge has weakened a bit compared to when I entered the position.
At current prices around $88,000, I’m sitting on roughly 290% gains. My approach for 2026 is conditional.
If $80,000 breaks down decisively, I will take profits. This level represents both the lower bound of my half-volatility forecast and a psychologically significant threshold. Even at $80k, I’d be locking in approximately 255% gains, a reasonable exit after a historically strong run.
My reentry target would be the $50,000–55,000 zone. This area aligns with both the full-volatility lower bound at $52,700 and my monthly KAMA deviation bands.
On the other hand, if $132,000 breaks to the upside, I will hold and reassess at the upper bound levels. This is not a bearish call, it’s risk management after a successful multi-year trade. The data doesn’t justify aggressive positioning in either direction at these levels.
Feel free to reach out with any questions, and I’ll see you in the next update. Happy New Year!
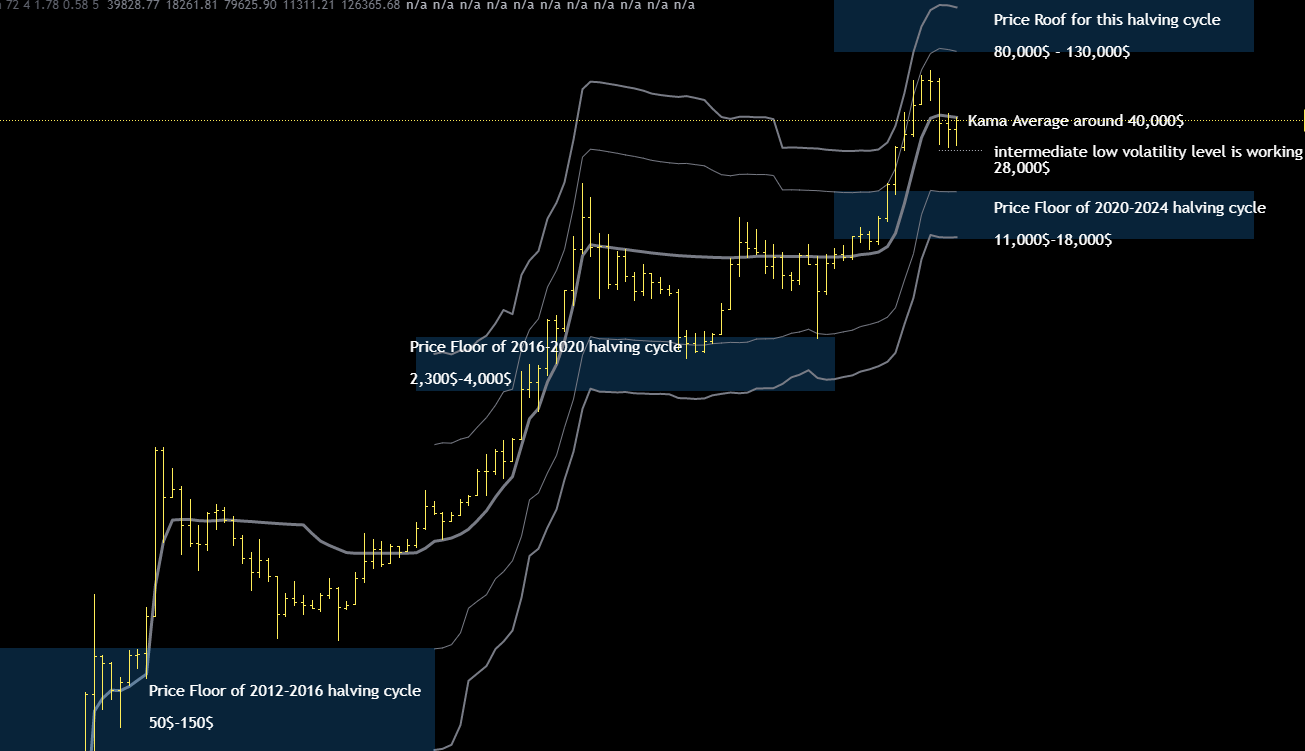
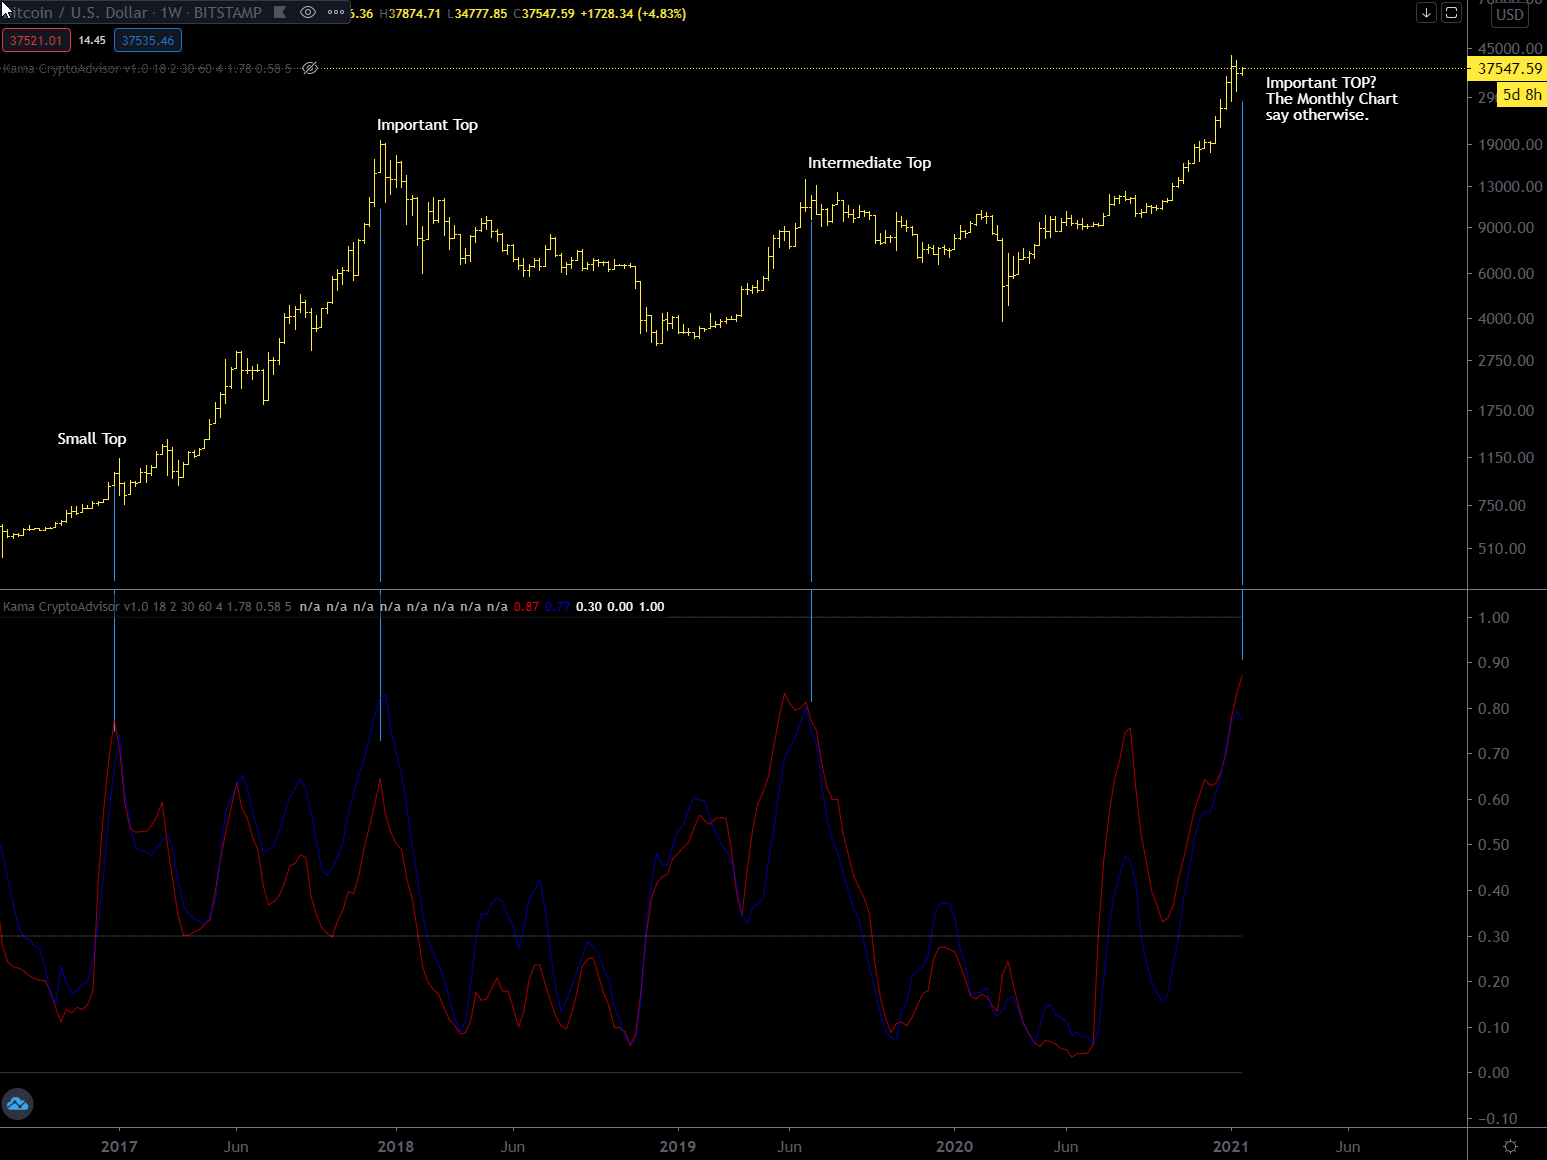
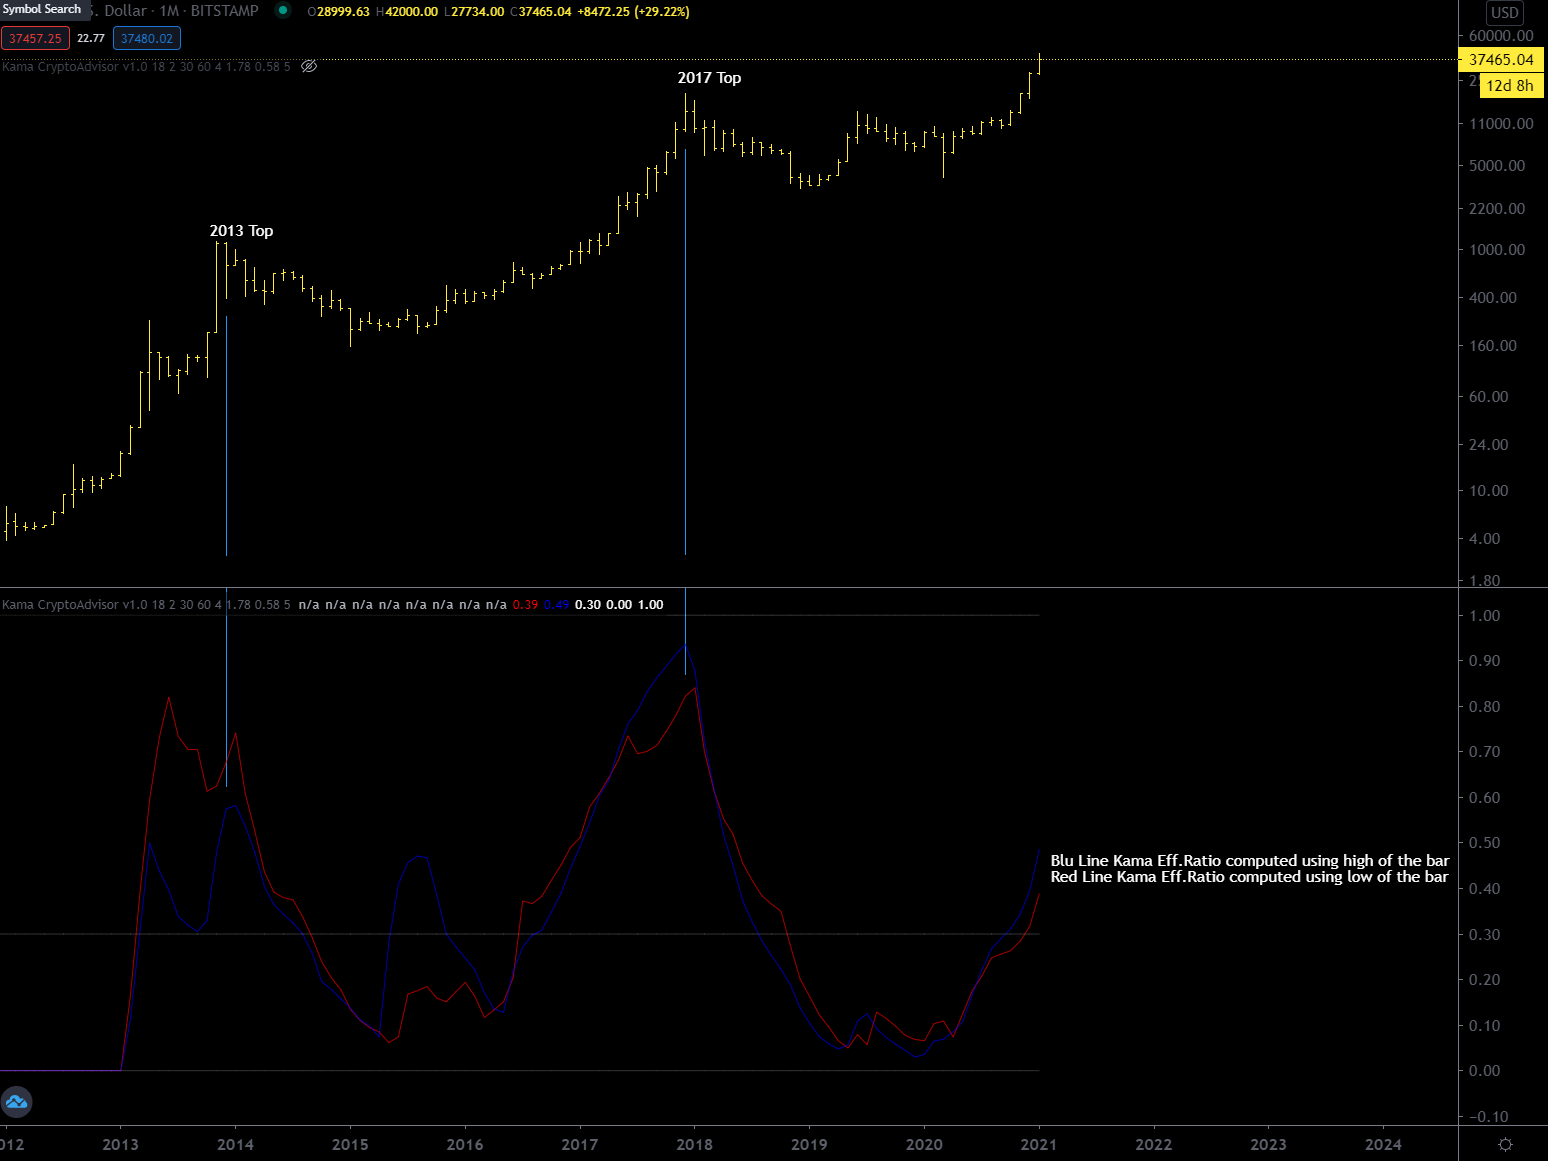
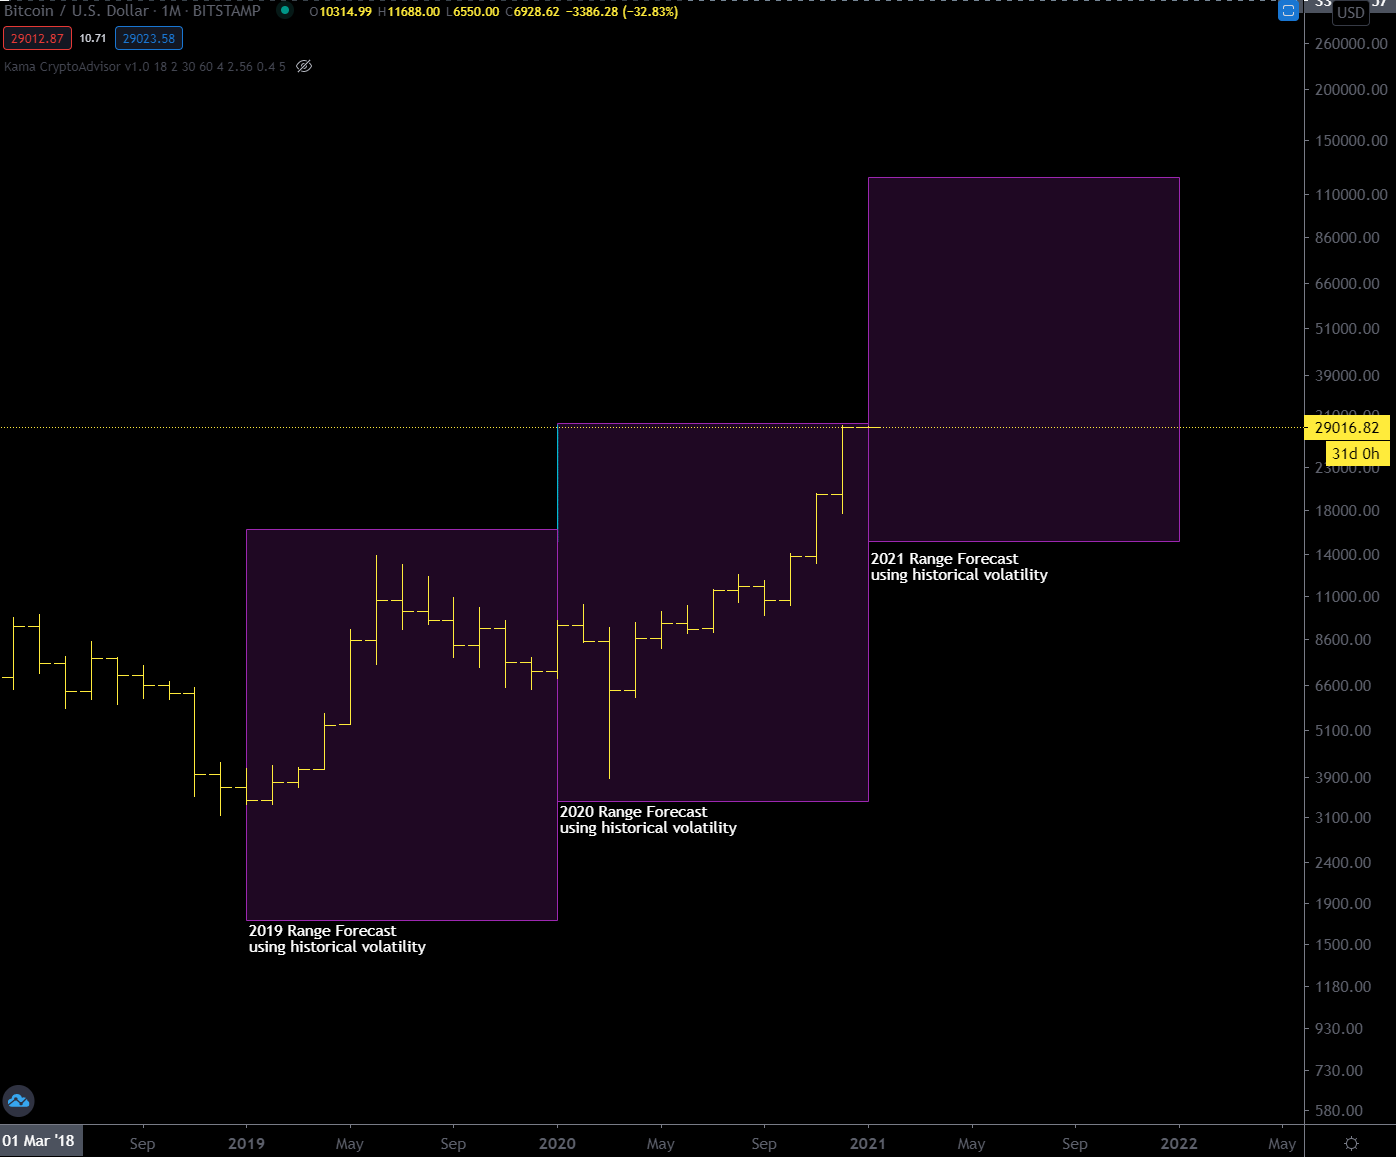
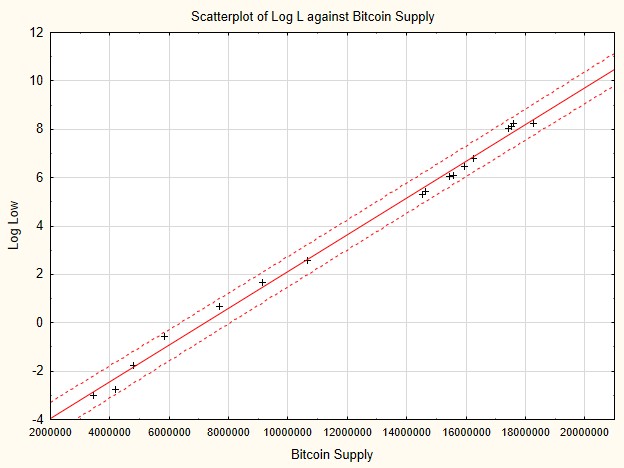
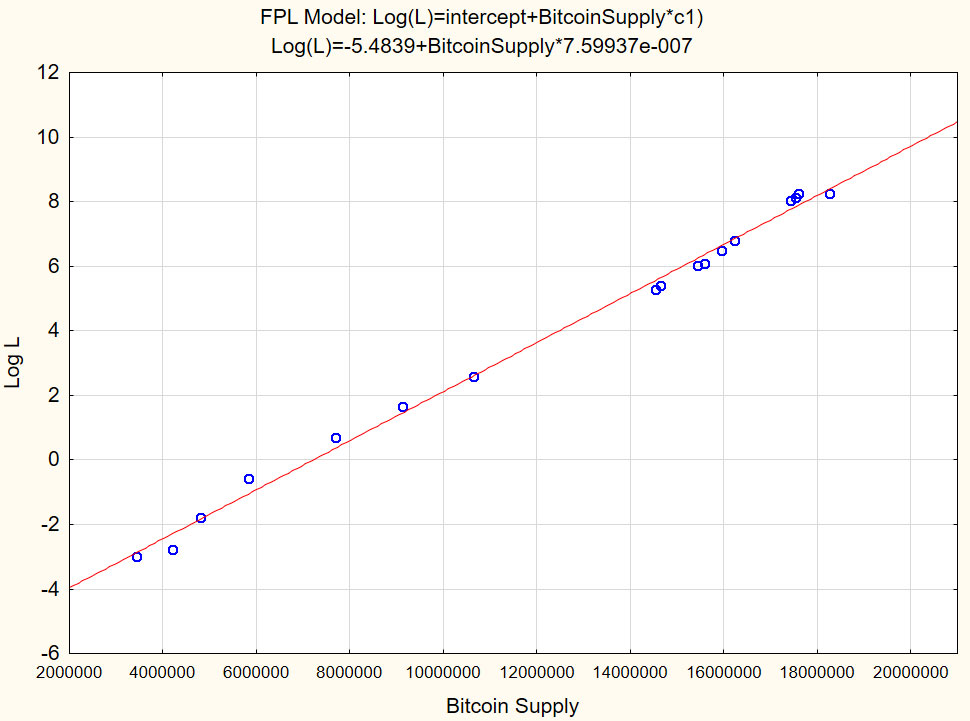
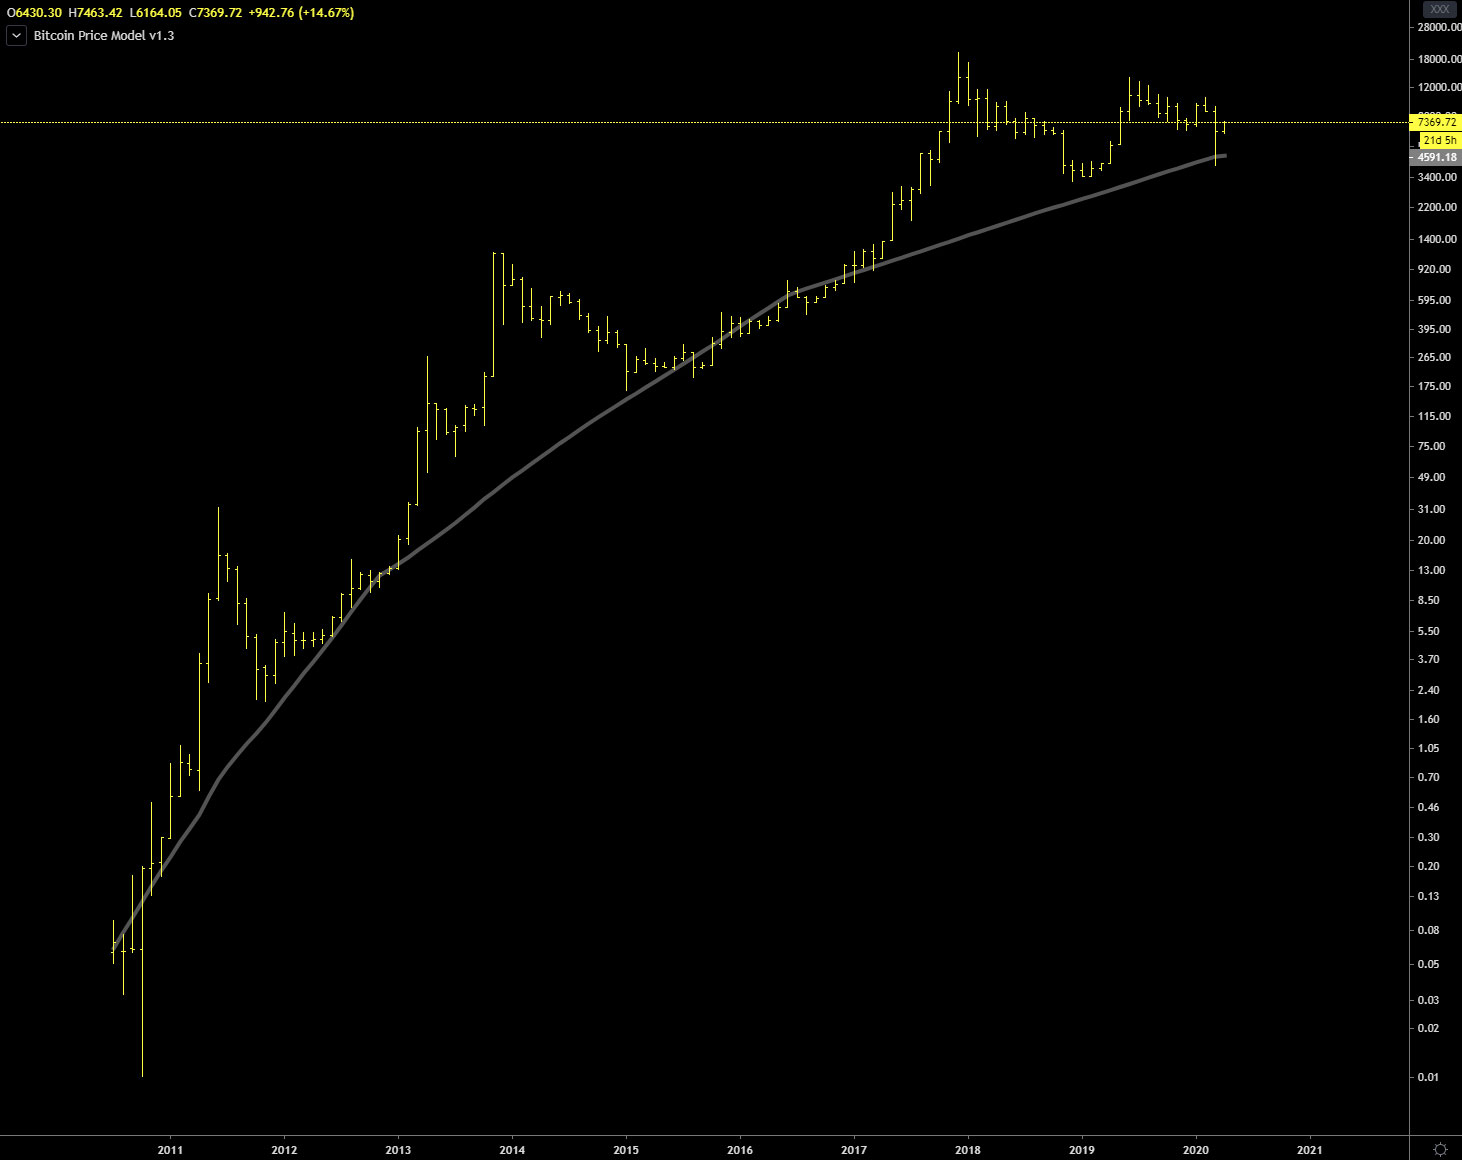
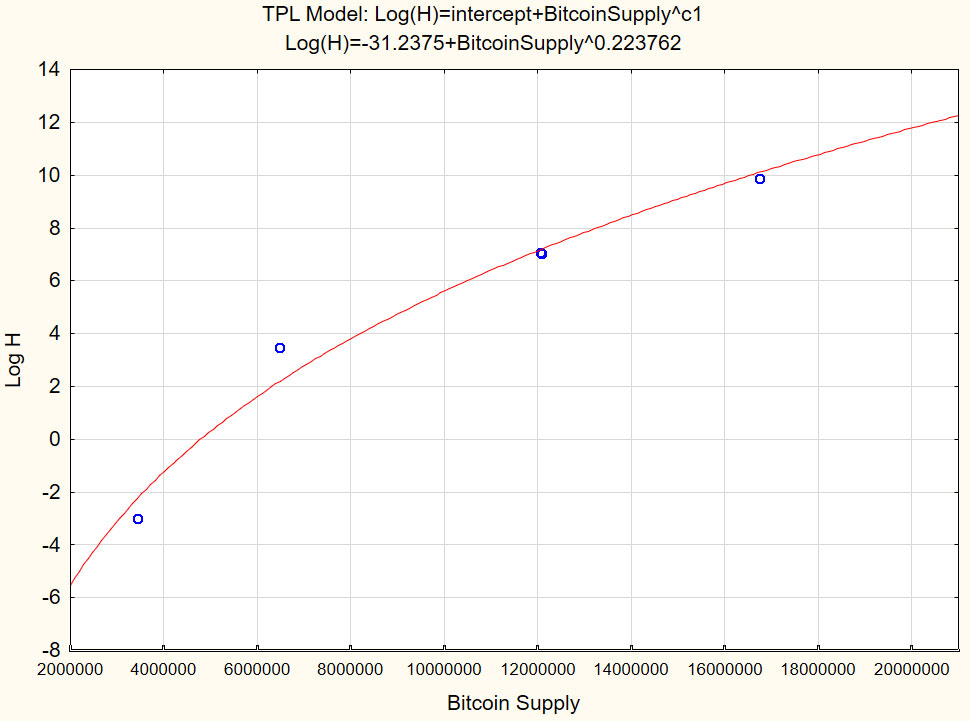
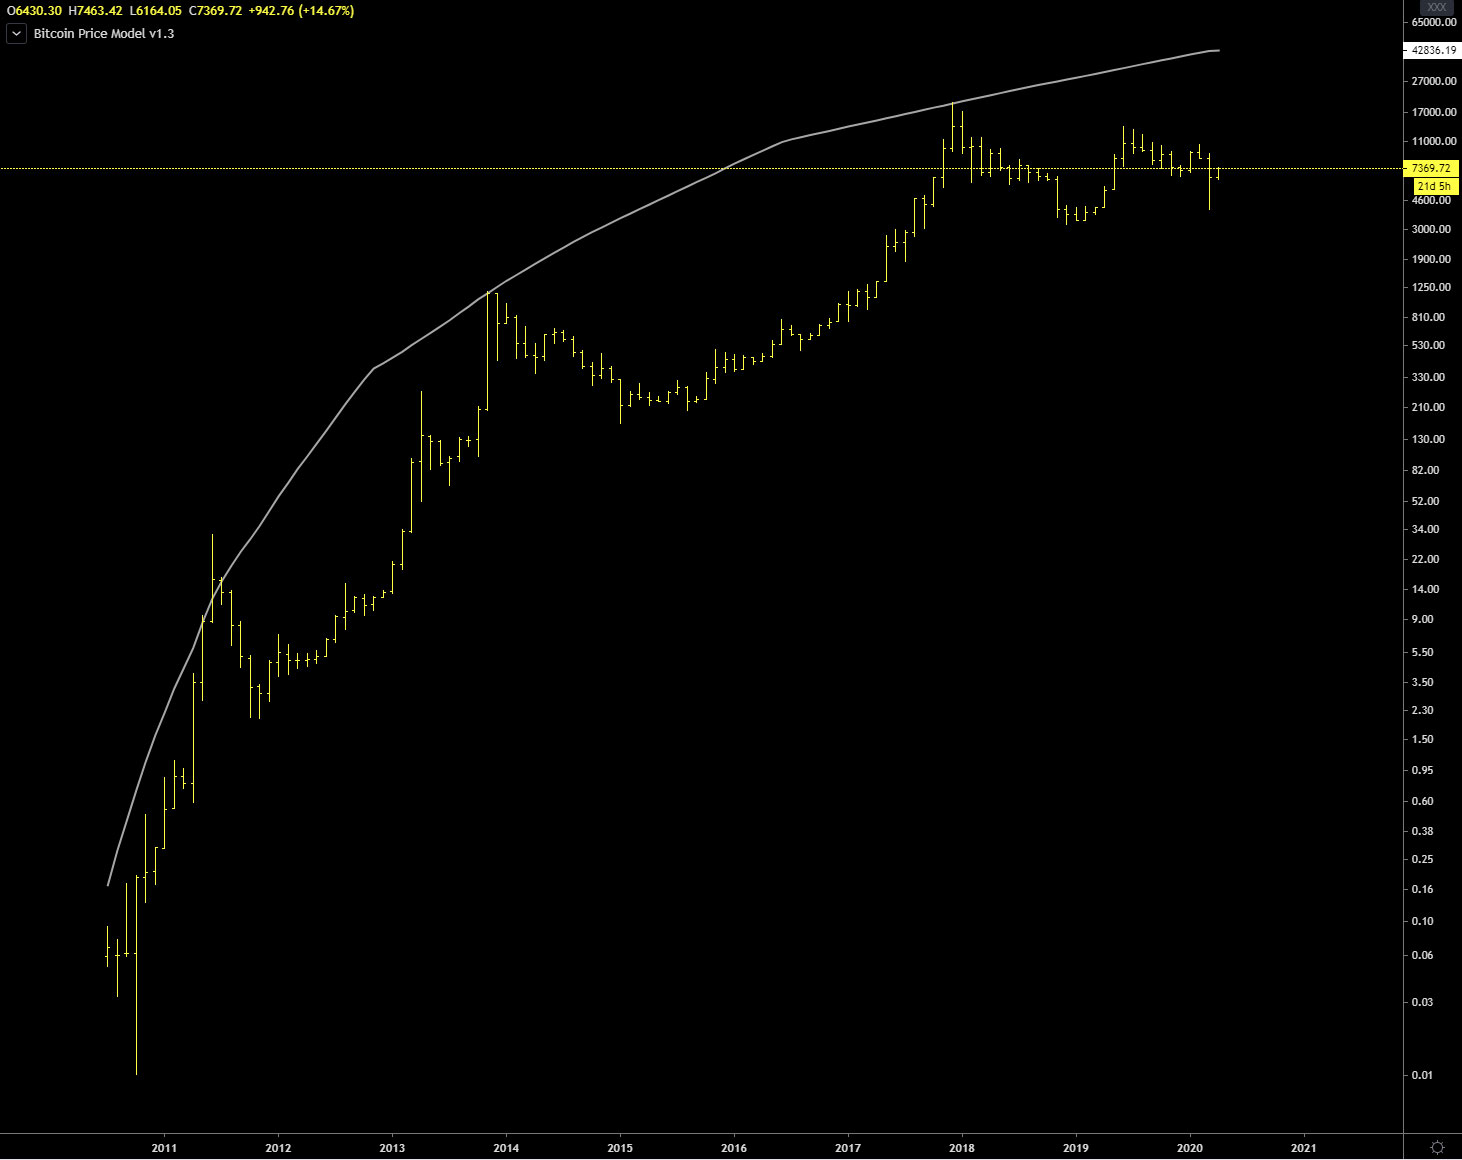
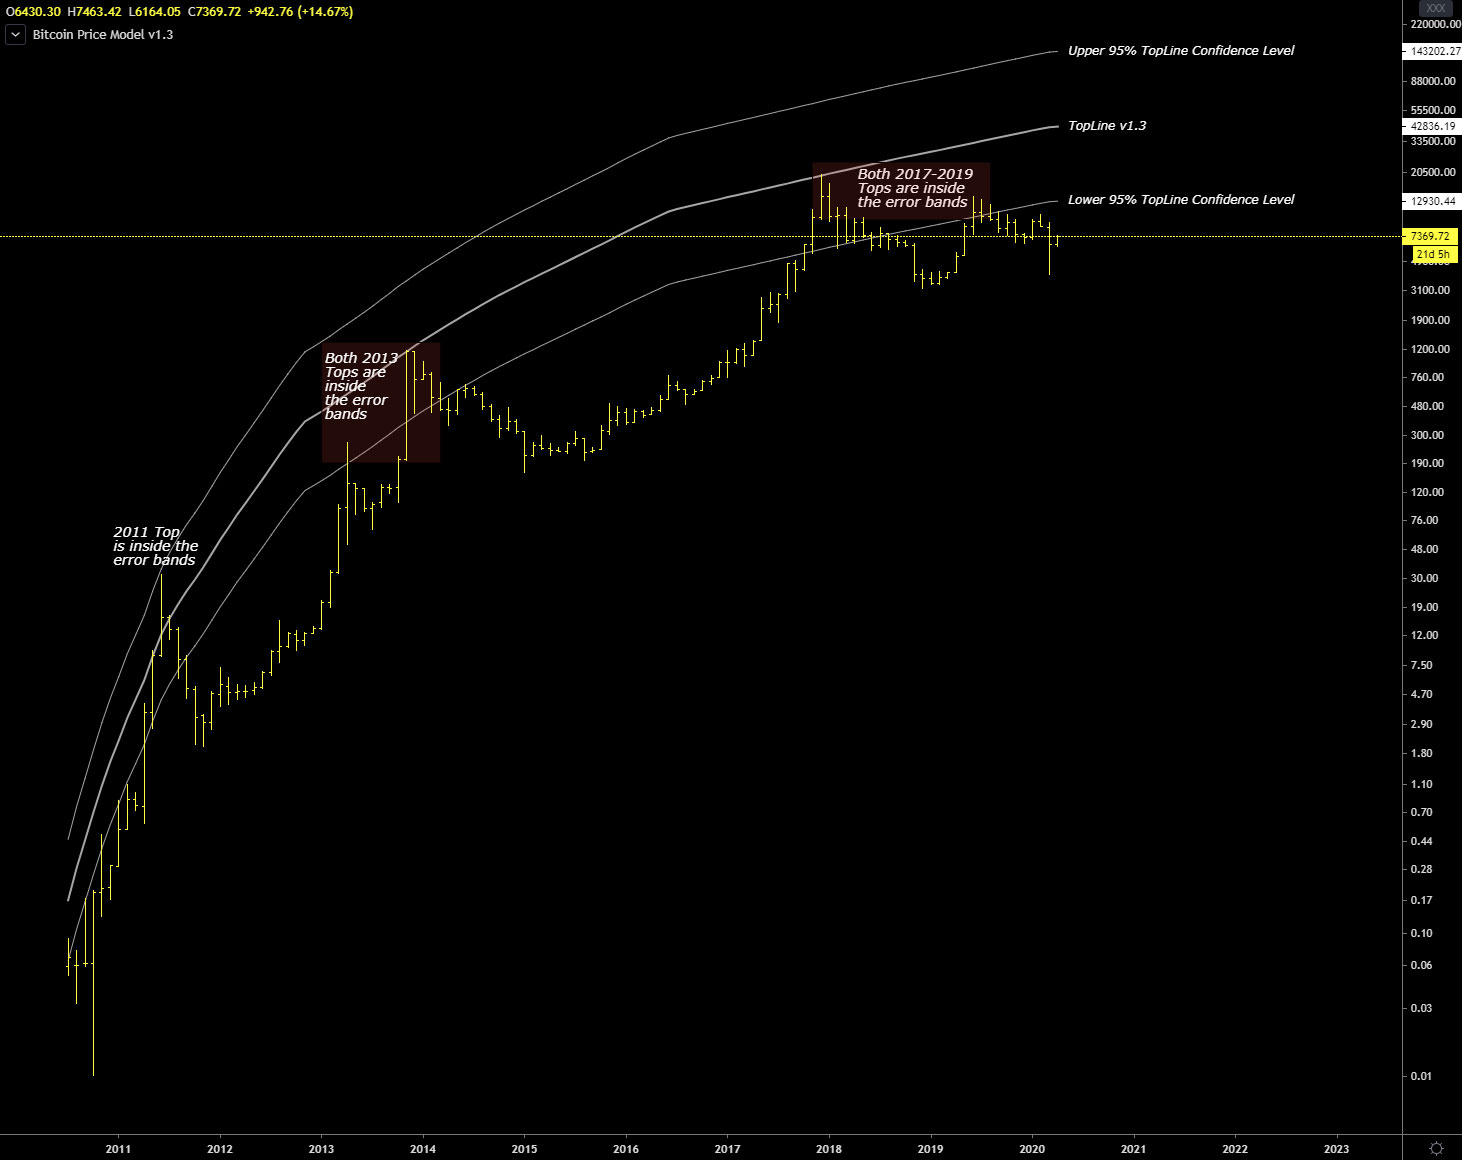
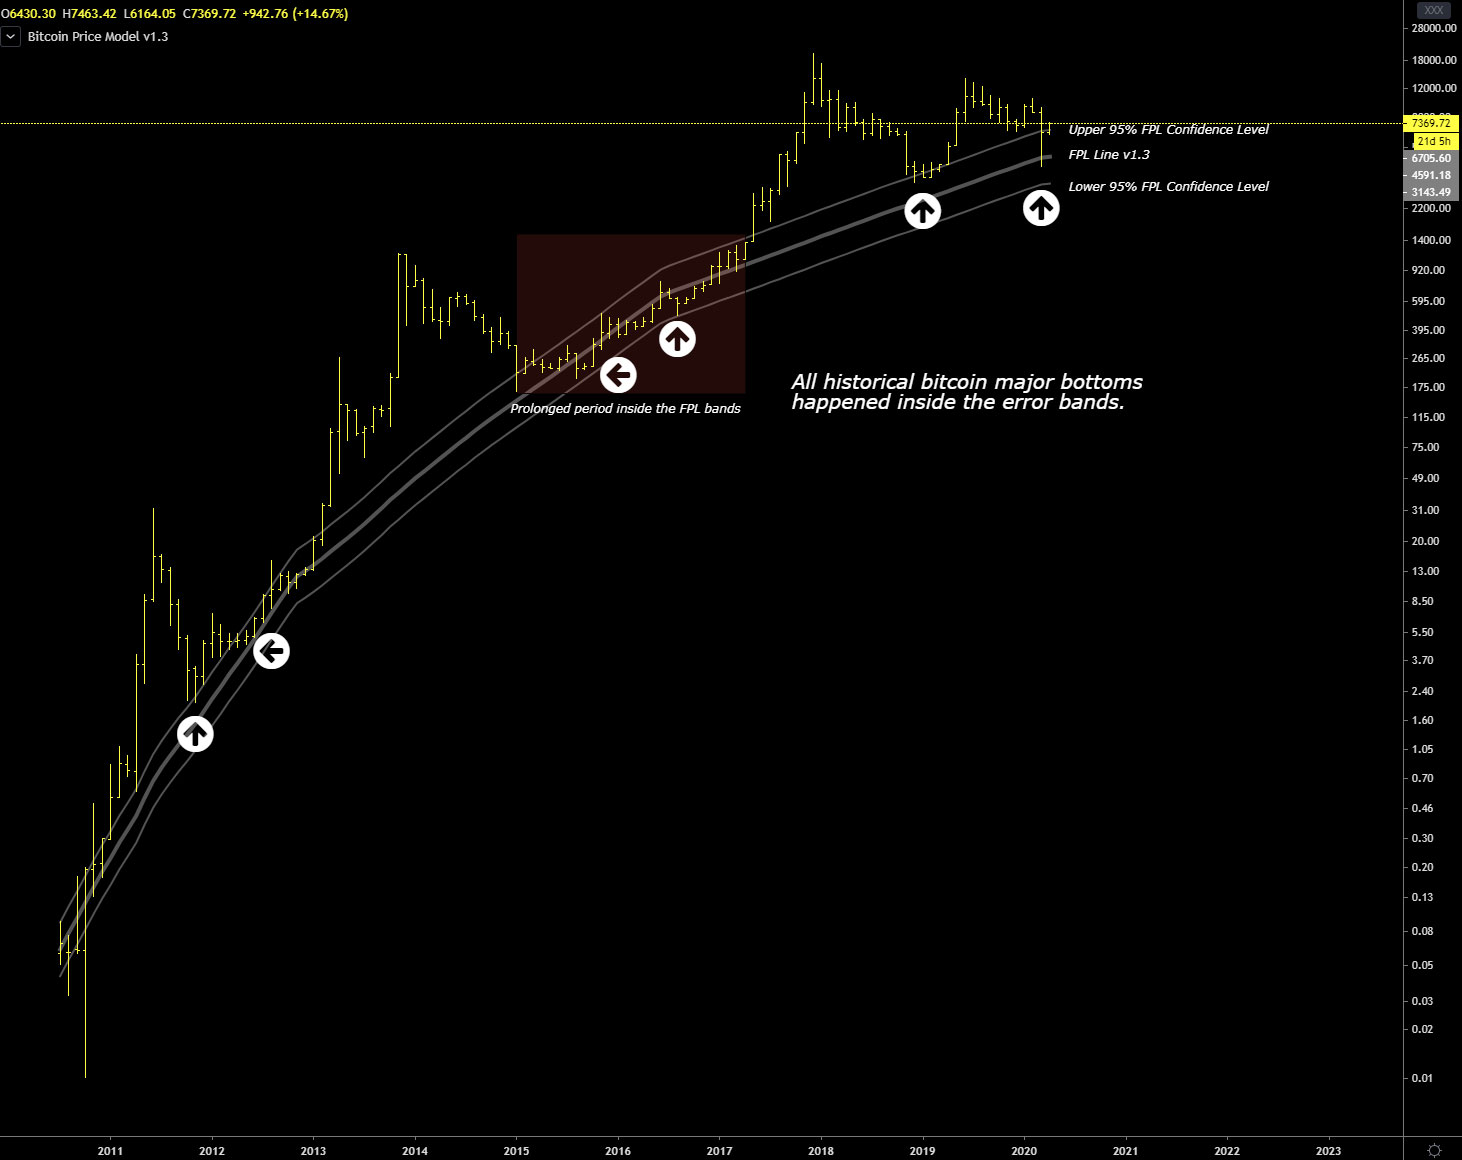
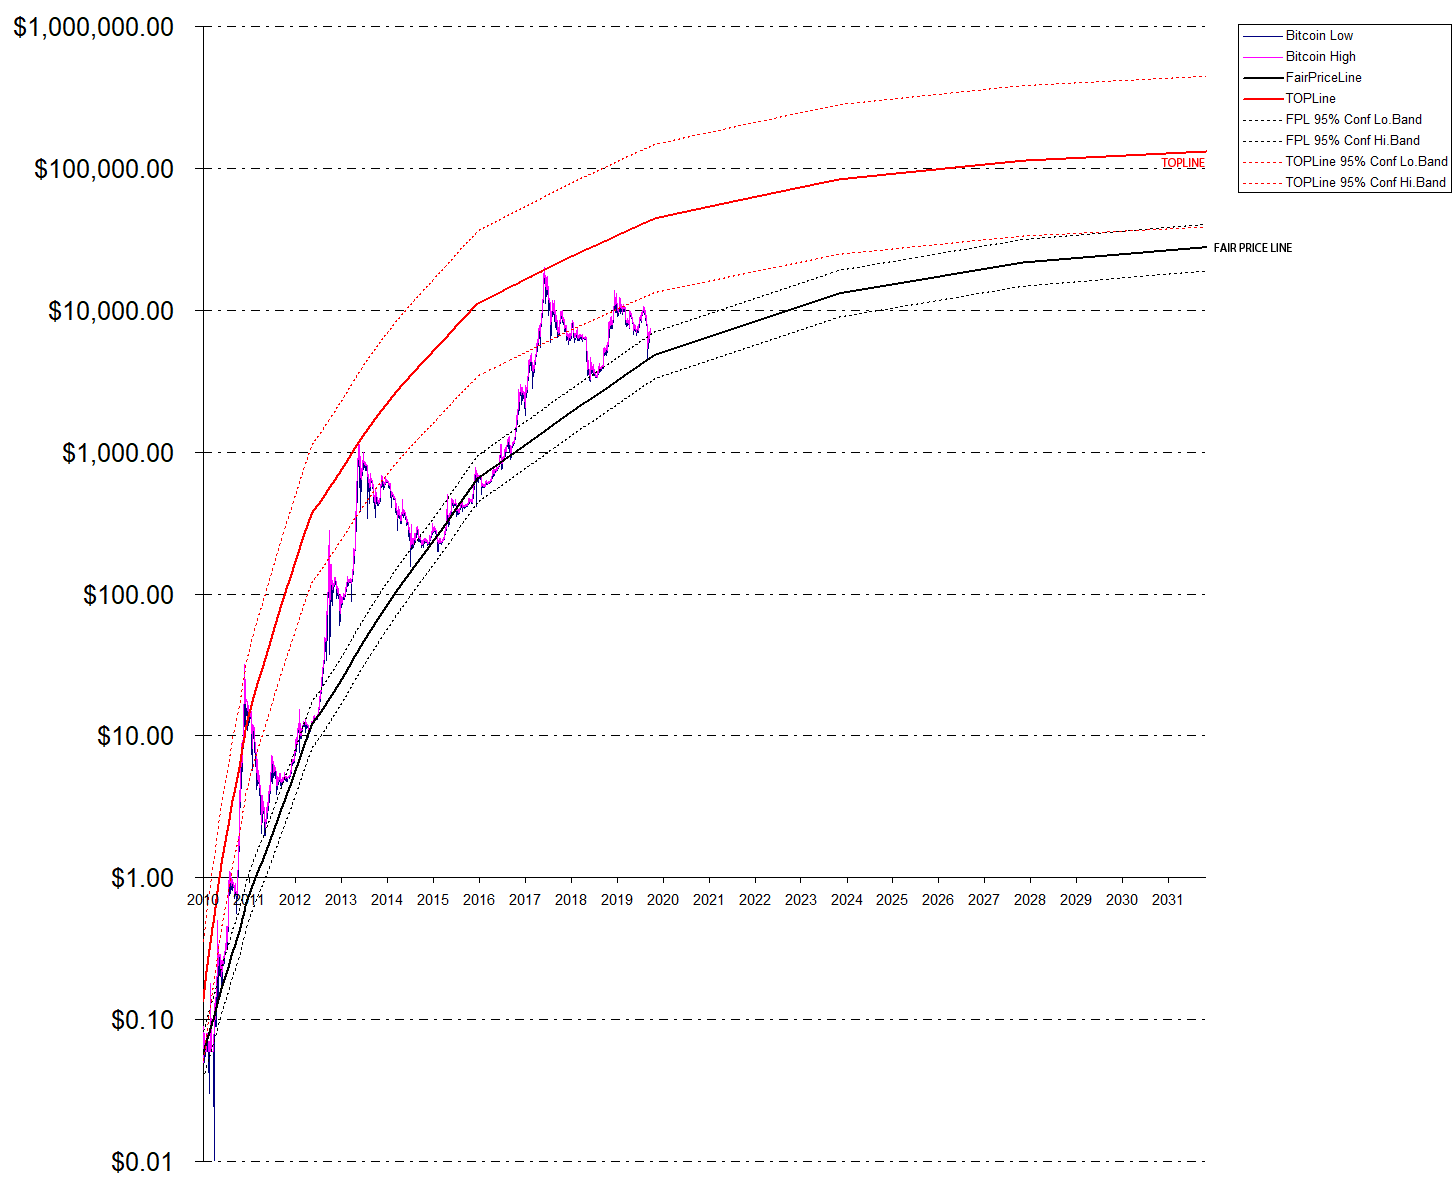
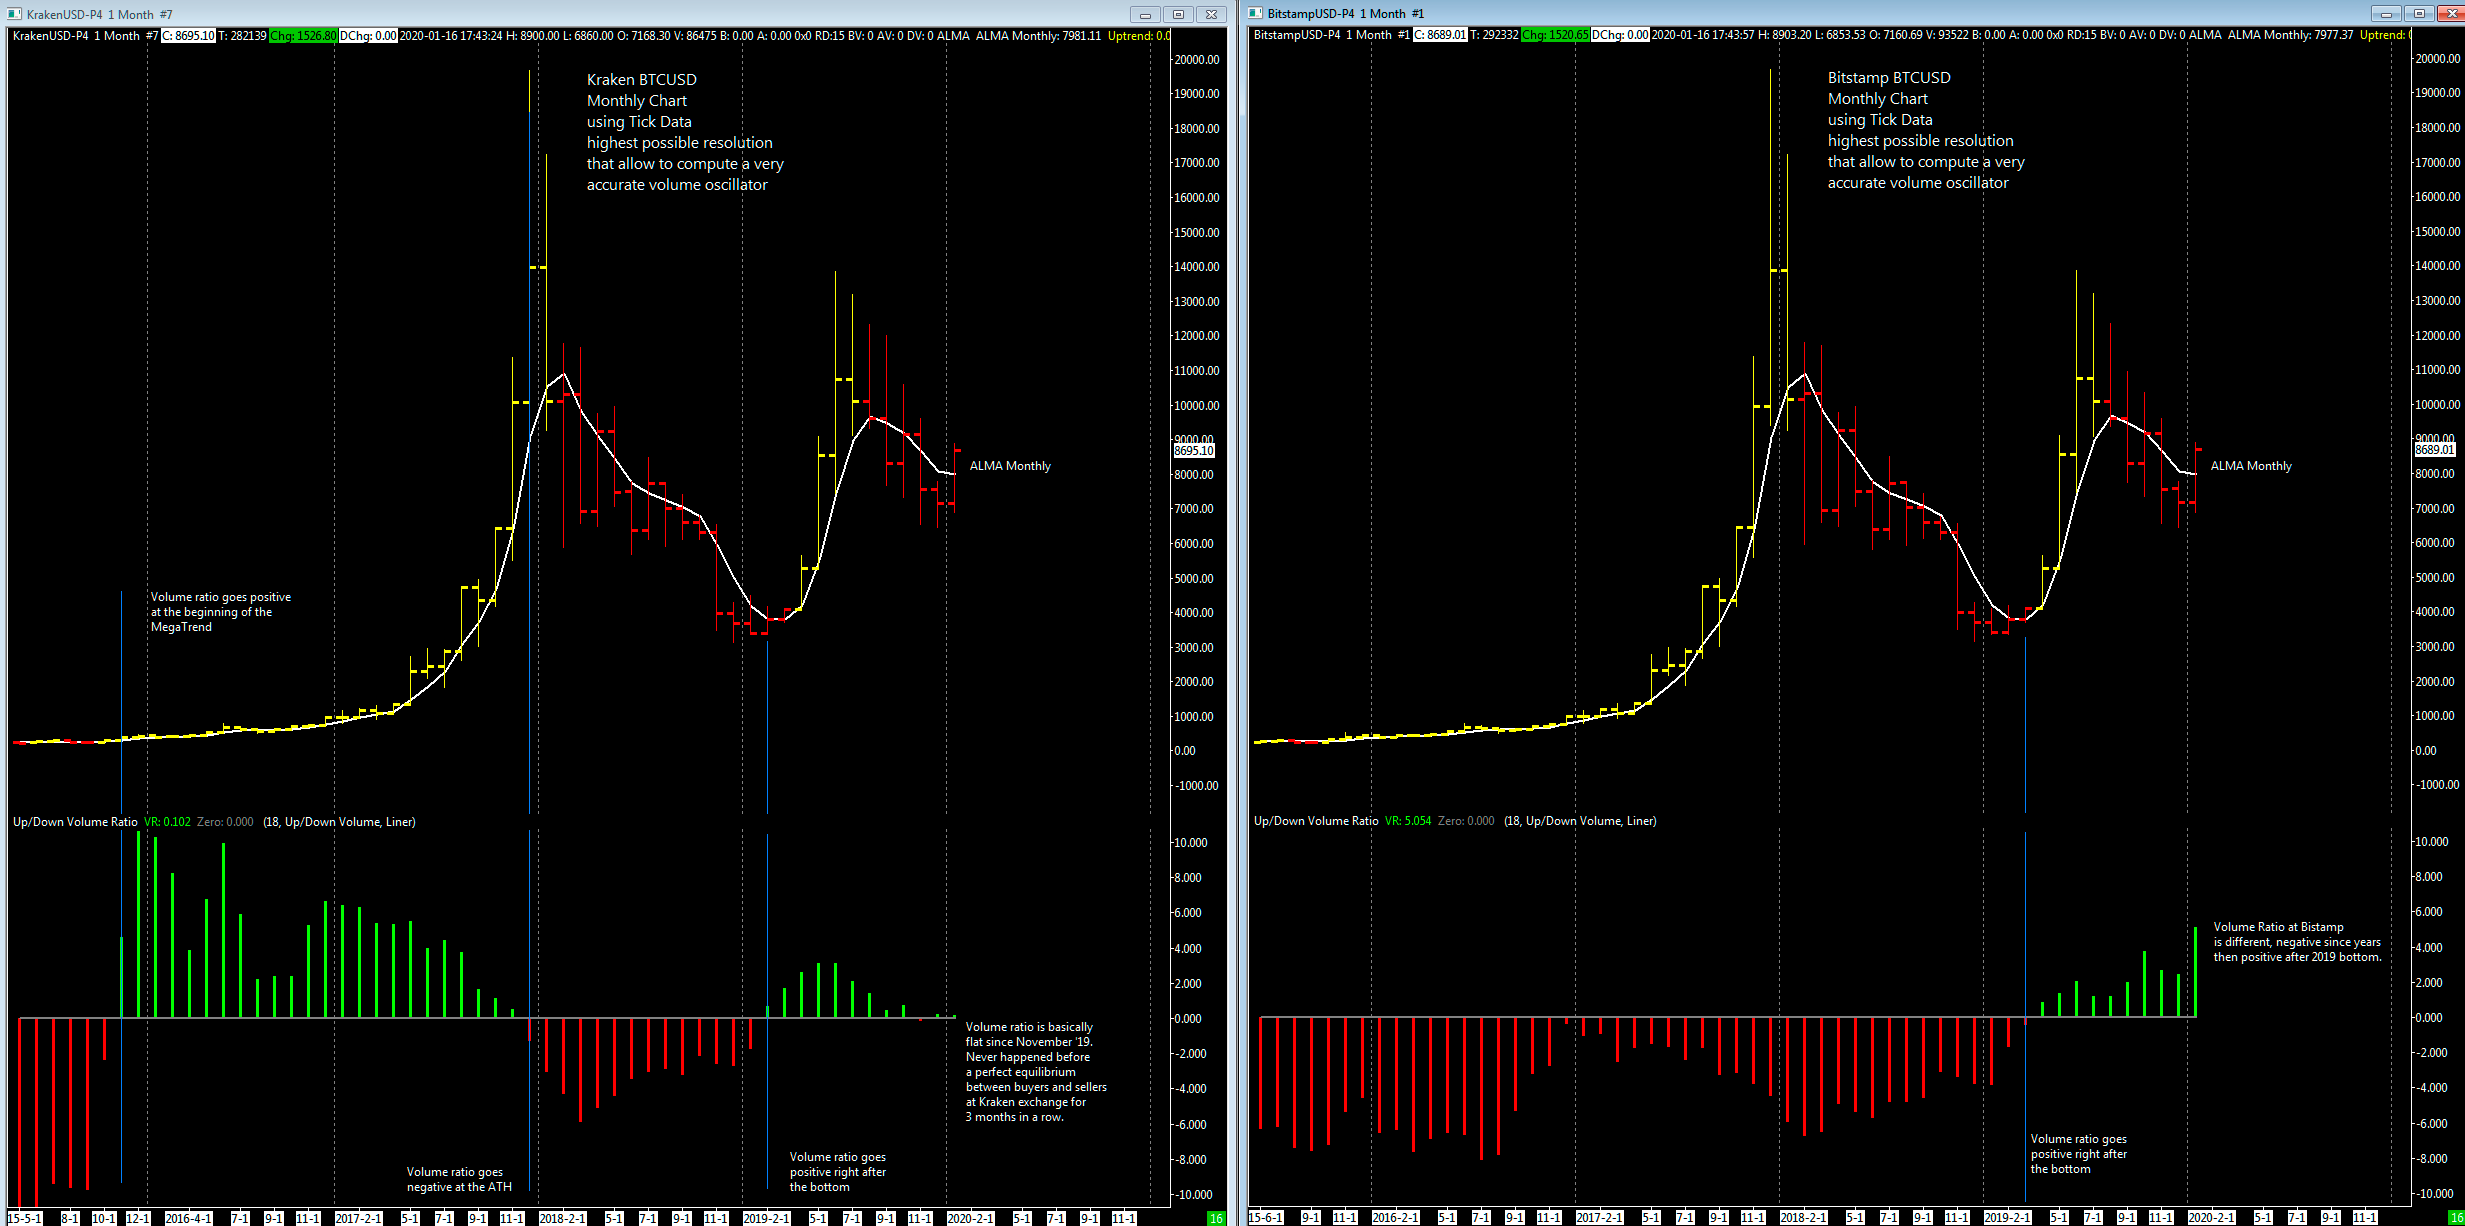
Charts