Short Term Update: MtGox Lag above 1 hour, interesting:)

chart

In the last couple of hours we have seen an extremely volatile market, with a yo-yo behaviour hard to manage for an amateur speculator is easy to get slammed, in such situations sometimes is good to don’t touch and wait and don’t let emotions take over. Aniway, in the above image the market strongly reacted down near the second standard deviation of the VWAP, at 105$, after a severe and chaotic drop, i tend to consider this drop a market glitch because of the high lag due to a problematic trading engine at MtGox.

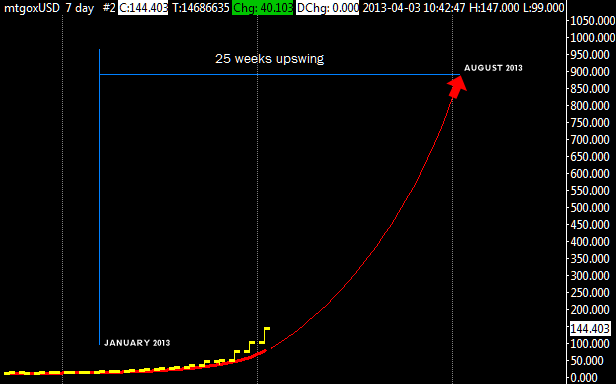
On a weekly basis, the trend is still up, trading activity is growing and show an good volume activity. The weekly moving average is unaffected by the recent wild swing, the ALMA moving average for this week is at 130$, close to the bottom. The net volume indicates to us that the correction just happened isn’t catastrophic as it might appear looking the price drop from 265$ to 105$. The VWAP is at 150$ and i think that tomorrow the price will stabilize itself above that level.

As a side note i should say that a lag of 4500 seconds isn’t properly ideal, i hope that MtGox fix this embarassing situation as soon as possible, it’s in their interest. It’s simply unacceptable, ridicolous, that the leading Bitcoin exchange doesn’t stop trading operations during severe drops caused by hardware/software failure. It is blatantly obvious that with such an high lag and uncertainty people go to panic selling, MtGox should implement some sort of trading curb, also known as a circuit breaker, where trading will stop for a period of time in response to substantial drops in value.

Long Term Update: Bitcoin is going out of control:)

I consider parabolic fitting a smoothing algorithm with poor forecasting results in most cases, but apart from theoretical considerations let see in detail if parabolic smoothing and forecasting can help us finding a strong long term resistance for BTC/USD.

Parabolic rise is also called an accelerated growth phase, so after it breaks out from a long basing pattern (for bitcoin the 16 months prior January 2013), it starts a rapid growth phase with a series of ever-steepening, rising trend lines. The acceleration of bitcoin price appears as a parabolic curve on the price chart, and can happen that the final stage of the move will end with a leg that is virtually straight up with a buying climax last bar.

Parabolics almost always collapse, this is what worries me at the moment, sometimes there is a bit of topping followed by a precipitous decline, but other times the straight up move reverses into a straight down move of equal or greater magnitude.

What is doing now bitcoin is a good example of a parabolic rise in an early stage, using last 10 weeks i derived the formula of the current parabolic that bitcoin is following:

y = 1.81 * x2 – 11* x + 35    where x2 is x to the power of 2

As i explained many times i think that normally a swing can last up to 25-30 bars, in this case weeks, extrapolating the above formula i can compute a target (you can do the same just substitute “x” with the number of weeks).

With 25 weeks i’ve a target of 890$, using 20 weeks i’ve a reasonable 540$ target; i think that a long term top beetween 500$ and 1000$ is likely to happen, all depends if bitcoin will reach the wall street crooks or not:)

chart

Jokes apart, if this weekly upswing will last 25 bars then the top is due next August/September 2013.

Short Term Update: daily view MtGox

chartThis is a daily view since mid February, 2013.

It is clearly visible how  much strength there is in this uptrend, in the second pane of the chart there is the net volume and i report  a nice buying activity after the breakout of the old resistance at 49$, buyers are predominant at all time high and again this is very bullish; usually before any explosive price breakout to the upside there is a period of consolidation and it’s exactly visible on the chart in the 10 days from 7 to 17 March.

The VWAP is the main support level and now it’s at 46$ for this month, the price breakout above 49$ broke the second standard deviation line confirming the nature of the move as an explosive breakout, the target for this month is now at 90$ and i computed it as usual using actual volatility that is 70% higher compared to the level seen in June 2011 top, absolutely remarkable.

For the bears, if there are any outside there:), the first bearish sign is a drop under 54$ then the penetration of the vwap under 46$ should confirm a reverse in the trend.


Again on VWAP

chartIn the last days we have seen an extremely volatile market, with the yo-yo behaviour of the last thursday, it is easy for an amateur speculator to get slammed during a 33% correction. In this situation a better approach is to try to figure out whether current prices are high or low relative to a normal price range. If you can do this you can begin to trade any market with confidence and VWAP is a powerful tool do to this.

I do that, thanks to Sierrachart vwap add-on, computing support and resistance with an estimation of current volatily and the time considered for the forecast (cumulative since day 1 of each month as illustrated in the above chart). So if the market goes under the -1 or -2 standard deviation line support and then you have a buy signal you may try to “take a stand” or basically telling everyone that you think the market is under priced and telling to other market partecipants that they might have made a mistake by pushing the market too low. It is visible in the attached chart how VWAP give support if volatility is not extreme and if so market can find support at the -2 standard deviation line as happened 3 days ago.

On a weekly basis, the trend is still up, trading activity is growing and show an increasing volume activity. The weekly moving average is unaffected by the recent wild daily swings, only if price stays below the VWAP for many days drifting lower and under 35$ then i can conclude that the long term trend reversed to the downside with a  downtrending VWAP line.

For who use Sierrachart  to follow MtGox with slush plugin, i’d to inform you that now is possible to follow also MPEX stocks with real time quotes with a plugin licensed by kakobrekla, you can contact him at bitcoin assets irc channel for more detail, IRC handle is kakobrekla

Short Term Update: Introducing a new tool, the VWAP

chart

This is a short term view of last 2 months when this market started to rise from 13$. On the chart i’ve attached the VWAP or Volume Weighted Average Price. VWAP  is equal to the sum of the volume of every transaction multiplied by the price of every transaction divided by the total volume for the trading day.

The theory is that if the price of a buy trade is lower than the VWAP, it is a good trade. The opposite is true if the price is higher than the VWAP. But, because of the great strength of BTC/USD, in the last 2 months rally the price has been always above the VWAP so it’s hard to say now if it is a smart move to sell. I’ve added on the chart also 2 standard deviation lines (+1 and -1) , the standard deviation is computed using differences from close and vwap.

Btc/usd at the moment is drifting up following the +2 deviation line (not  plotted in the attached chart) and it is very bullish. A good entry point could be a drop to the +1 deviation line at ~27$.

Understanding how price interacts with the VWAP price and its standard deviations dramatically fine tune both entries and exits and gives you a professional edge.

Here’s another example with an intraday chart of today:

chart

Chart starts at midnight of 28 February GMT time. As you can see the deviation lines provided both support and resistance giving you an edge on where to place your entry and exit point. Note how the price interacts and extends beyond the VWAP testing the 1st upper standard deviation. Next deviation line is at 33.8$ for today. For who want to give it a try, hit F6 on a sierrachart chart and select the indicator named “Volume Weighted Average Price” from the “Studies Available” list on the left. On the same window, on the right, there is the “Studies on the Graph” list where you can select the added VWAP and customize options. For intraday i recommend to set the VWAP options to:

  • Input data = last price
  • Time Period Type = days
  • Time period length = 1
  • Distance Multiplier = 1 (or 2,3,4 to see bigger deviation lines)
  • Continous non resetting std.deviation line = no
  • Continous non resetting mode = no
  • Base on underlying data = yes
  • use fixed offset instead of  std.deviation = no

Short Term Update: MtGox daily chart

This is a short term view of last 3 months,the market after a long accumulation period spent at 13$ exploded to the upside without any resistance.

chart

I’ve talk about a target area at 24-26$ in my previous update, btc/usd reached this target area very fast but considering the strong reaction seen from the last low at 21.7$ i think that at this point is unlikely to see a drop , bulls are still in control of this market IMO. Instead  i’m more for a consolidation around 27$.

If 22$ got broken then i think it is a confirmed short term reverse and it might last some weeks but i’m confident that bitcoin will remain above 22$ for the upcoming months.

Every time the bears tried to push down the market the bulls quickly stepped in supporting and pushing the market higher, this is a typical behaviour that manifests the high level of bullishness in this market.

To conclude i’d like to add that this market has surprised me with its persistent strength. It appear the bears have simply walked off to the sidelines and waiting their turn to feed, probably ABOVE the all time top of June 2011 at 31.91$.

Personally i think that this year we will see an higher top,  at least at 45$, but it is not excluded an higher top at 75$, all depends from the level of volatility that there will be.

Short Term Update: MtGox Daily Chart

chartAgain, i’ve just seen a 2 day break as the one seen last January 24, market dropped less this time about 19%, against a 25% correction of the January drop.

For the moment, i decided to raise my stop profit to 15.00$ and give the market few more days to see if it will rebounce from here, looking the net volume i see just normal corrections of a strong uptrend and i’m not worried.

This week BTC/USD currency pair should stay above 17$ and below the upper end of the price area i defined for this week, 24$-26$

Quick Short Term Update: MtGox Daily Chart

We have just seen a 2 day break and the question is whether or not it is just the first stage of something bigger; i’ve the answer and the answer is no, i think bitcoin will hold the 15$ level, 15.4$ was also the old August 2012 top and i think that now this level defines a price support area. I don’t expect a bearish development after the prolonged period of accumulation spent at 13$ that fueled the rally up to 19$, and as long as it stays above 15$ level it will have an upside potential the bitcoin/usd currency pair.

To conclude looking the net volume i haven’t seen a big aggressive selling activity during the sell-off, buyers supported very well the drop and i interpret this as bullish behaviour.

chart


Long Term Update: Weekly View at MtGox

chartThis is a weekly view since may 2012. It is visible the August top at 15.40$ and the double bottom at ~9.70$, in the second pane of the chart there is the net volume and it’s clearly visible the strength of the current solid uptrend, buyers are predominant even in the last 4 weeks of congestion spent at around 13.3$.

I include as usual in this first post of the year a forecast for the 2013, considering actual volatility it will be very hard for BTC/USD to go above 18.7$ before the end of 2013; at the same time bitcoin shouldn’t go under 9.6$ (that correspond also to the recent double bottom).

A confirmed drop under 9.6$ is without any doubt a strong bearish sign; by the way the market seems to be holding well at the moment and stable above 10$.  In case of a correction in the weeks to come, just looking at the chart and applying the principle that higher highs typically follow higher lows i can project one obvious downside target for the BTC/USD and it is located around 12$, above previous 9.7$ mid-term low and it represents also a 50% price retracement support.

Short Term Update: MtGox daily chart

chart I was expecting a major drop after my last update but BTC/USD reacted immediately and at the moment it is finding resistance at 13.5$ where the ask side of the book is heavy loaded up to 14$ and for the short term i think bitcoin will need more time to get through that resistance zone.

After 23 price bars (or 23 days) spent after the break out of the 12.7$ level (happened on 4 Dec) and considering that usually a congestion may last up to 30 bars, i think that in the next 1-2 weeks bitcoin will finally take a decision and it will go somewhere above 14$ or below 12.7$; considering the underlying long term trend the odds are for an upside breakout.

In the last month, when a small intraday drop occured, every time buyers stepped in buying this market, this is not bearish but bullish behaviour, i dont see aggressive selling activity because sellers probably want higher prices and have lifted their target selling prices and they are unwilling to dump at these prices their coins. This is my interpretation of what happened in the last month after the halving date.

Price range for next 1-2 weeks is 12.6$-14.15$

Happy New Year and see you guys in 2013.

Short Term Update: Daily View at MtGox

chartThis is a daily view since november 2012. It is visible the halving block date that does not have affected the market uptrend. In the second pane of the chart there is the net volume and it’s clearly visible that a mild short term correction has started few days ago.

I calculated that if the volatility will not rise the support will be around 12.15$, i’ve drawn two static support lines in the chart and i’m confident the market will not go down the second one at 11.7$

This weeks range estimate is 12.4$-13.8$, eventually 12.1-12.2$; i’ve in mind a large stoploss for this long term trade but if market will break down the 12$ level with high volume i’ll have to reconsider my long position,  but so far the drawdown is manageable and acceptable.

Short Term Quick Update: MtGox daily chart

chartBitcoin to Usd currency pair so far has completely ignored the first block halving of its history, i see some resistance at 12.6$ and looking the book is not so bearish.

Volatility stays low, i don’t expect the market to go under 11.7$ next week with this level of volatility, so for now the market is still in an uptrend, the key level to break is 13.1$, above it i’ll open a long term trade with a wider stop loss, probably under 9.5$

For the short term i compromised the recent buying opportunity  because i’ve preferred to wait the halving block date. For who is already long in the short term and he is not interested to hold for the long haul would be wise to watch out the 11.5$ level as a potential stop loss and the 13$-13.4$ price zone where to cash profits.