Short Term Update: VWAP test

chart
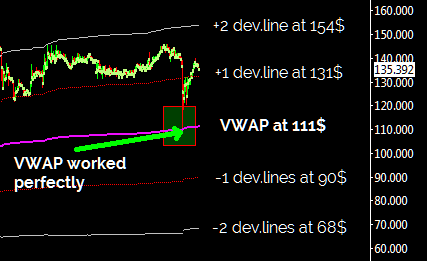
Yesterday there was the first serious profit taking by investors of this strong advance in price started in late September. In these cases it is very important that the average VWAP stop the fall of prices and in fact it worked perfectly despite the large volumes that occured at Bitstamp , about 50000 bitcoins .
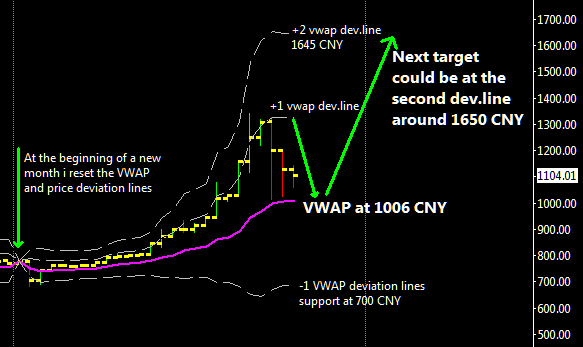
At this point it is very important to stay above 270 dollars and possibly to react from here up to the second statistical deviation line of the VWAP located at 410 dollars,it would be a good top for November. It takes a lot of strength to go up further and it is very likely that we can drop during the next week down to $ 200, which i consider a very strong support and very important not to violate it.

For now I am waiting for further developments before taking a decision for my open trade , in the case of a break of $ 200 i will be practically forced to close the position to avoid to violate a fundamental rule of trading : do not to allow a profit to turn into a loss; it is very easy to fall in this mistake in a volatile market like this where winning trades can quickly turn into losses.

See you at the next update, and good trading .

Short Term Update: Daily Chart at Bitstamp

chartIt is clearly visible how much strength there is in this uptrend, the VWAP is the main support level and now it’s at 265$ and rising, the price breakout above 200$ has been important confirming the nature of the move as an explosive one, the target for this month is now at 420$ for bitstamp and i computed it as usual using actual volatility that is very close to the insane level seen in June 2011 top, when bitcoin moved from 50 cents to 32 usd in 2 months. I think that there is now enough buying activity to sustain this upmove and it will probably not repeat the crash happened last april, therefore i conclude that my initial target of 340$ will be cleared (it is already happenning right now at BTCchina where converting in usd price is at 416$).

For the bears, if there are any outside there:), the first bearish sign is a drop under 300$ then the penetration of the vwap under 265$ should confirm a reverse in the trend.

Long Term Update: still trending UP

btcusddailyHere is one of the daily bar charts i use to keep track of the current bull market trend. The first thing i notice in this chart is that the BTC/USD is very high and above a rising 200 day moving average (white line) ; a typical bull market configuration. The price is also above its 50 day moving average (red line).

Reactions within a bull market typically take the price below its 50 day moving average and near its 200 day moving average. The July 5 low at 65$ is a good example of a  reaction that terminates at the 200 day moving average and below the 50 day moving average.
The position of the 200 day moving average in this chart give us a reference limit of a correction within an ongoing bull market (now around 120$), so this means that the next important bottom should be at or higher then 120$.

A first possible sign that the bull market is near the end would be a  strong drop below its 200 day moving average followed by a quick rally back to it with a 50 day moving average pointing down. It is not the case here with both averages advancing strongly.

Thinking back to April top at $266 at that time the price was 190 dollars above the 50 days moving average, projecting that situation today we should have a top at about $ 340 ($150 plus $190) which is what i’d like to see: a decisive break of the previous top at $ 266 that will probably attract many sellers.

Instead, a strong move above 350-400 dollars during this month would surprise me confirming the suspect that this market is probably really booming.

Short Term Update: daily chart at BTCchina

chartThis is the first update for BTCchina exchange on my blog and i dedicate it to the growing Chinese community of investors that led the recent rally from 700 to 1300 CNY.
While profit taking in recent days has held up perfectly the VWAP support level the price drop has been an excellent buying opportunity. I believe that if prices remain above the VWAP we could see a further rise towards the second line of statistical deviation of the VWAP which is currently positioned at about 1650 CNY.

In the event that the VWAP level is broken to the downside, i believe that we will find a strong reaction from buyers around the level of 700 CNY that should hold up without problems and it would be an amazing buying opportunity for the medium term.

Short Term Update: daily chart at Bitstamp

chartWhat we have just seen is nothing more than a profit-taking in a strong uptrend. As always, our reference is the VWAP line and for bistamp at the moment it passes at $ 147, say $ 150. I’m not worried as long as prices remain above this level, it is just volatility because of some investors cashing in profits by selling large quantities of bitcoins.

For those who want to buy it is always good to try close to the VWAP, particularly if it is trending higher like it is doing this month. For MtGox this month VWAP is at 160$, for btc-china it is at 1000 CNY.

Long Term Update

chartOn June, 5 2013 i wrote a long term update with a monthly chart included, at that time i was expecting a mild correction of 6 months with a final low above the 2011 top at 32$, instead this market started to rally again well before with a bottom in July , 3 months only after April top and with a bottom at 65$, much higher then 2011 top and i interpret this as a very bullish long term signal (when market bottoms and tops are well above previous ones).   I think that this market is on its way up above previous top of 266$ and the breakout might occur later this year or at the latest in the first months of 2014, as a confirmation of the growing interest in bitcoin the mining speed of the network is continously growing without showing any slowdown.

Regarding my open trade at MtGox i’ve now completely abandoned my operativity with it, i’ll trade from now on at Bitstamp. I’ve decided to keep my long trade open for now   (50 bitcoins bought at 140$ at MtGox) despite this market almost reached my mid-term target (185$ at stamp and 200$ at gox). For who is long and wants to play safe it is advisable to close at least half position and cash in some profits.

As i side note I would like to add that the decline in volumes and market shares of MtGox is really a good news, you couldn’t go along with a fully-centralized worldwide single exchange , it can’t last much. Now with btc-e , btc-china and bistamp the situation is much better and fairly uniformerly distributed as it should be in a foreign exchange market.

Short Term Update: Mid month View at BitStamp

chartThis is the same analysis of the previous udpate but adapted to Bitstamp exchange, why? Well i’m getting more and more worried for the sort of MtGox exchange, the book of orders is drying out with less of 35k total bitcoins offered on the ask side. Investors are looking for other exchanges where to sell their bitcoins without any worries if they decide to withdraw their money. So from now on i’m going to publish market updates also for bitstamp exchange.

My MtGox mid and long term target of 167$ and 200$ correspond to 152$ and 185$ for bitstamp, levels that might be touched this or next month. VWAP at bistamp is at 122$, an interesting level where to buy in case of a retracement.

DISCLOSURE: I’ve already moved out my accumulated profits from MtGox, converting them in bitcoins, i’ll wait to sell them at the same price in usd when possible.


Short Term Update: Mid month View at MtGox

chartAfter the initial price shakeout down to 109.70$ sellers failed to take control of this market, from there a strong daily uptrend started and quickly broke the 131$ intermediate resistance, a level that I thought it was hard to pass in case of a mere technical rebound after a strong bearish bar; instead BTC/USD reached the 153$ today above the 148.9$ top of September that it’s now a  broken resistance.

At this point i think that 167$ will in any case provide some resistance to this trend and it should be finally reached before the end of this month.

Volume activity is increasing thanks also to china gaining momentum since 2 weeks, a nice surprise and in the event of chinese big players trying to get on the train the momentum could increase to really high levels and probably my target of $ 167 might be a little conservative.

Long term VWAP third deviation line it is currently at 200$, a more probable target in case of strong momentum.

Short Term Update: 4 hour chart at MtGox

UploadImageIn last post i was thinking about a shakeout rather than a true breakout towards lower prices, well i think that we have just seen a strong shakeout after a bearish news for bitcoin (actually i consider it a positive news, i don’t like to see bitcoin associated to criminal activities of any sort). The volume average i’m plotting since the last major bottom of July worked out perfectly, the strong rebound from 109$ ended right now and it’s possible that a secondary reaction develops with a drop down to 125$ or so (testing again a static level i consider relevant).
Outlook for October is flat but any strength above 145$-150$ should carry bitcoin to my mid-term target of 165$-170$.

Quick Update

chartA quick flash crash and BTC/USD is again at around my static support,i think that this drop is temporary and i bet that the VWAP will provide support at 107$ for the coming days. I’m not going to close my half position (50 btc bought at 140$) before a price stabilisation that will occur probably somewhere between here and 105$.
If 105$ will not hold then there are the 2 deviation lines indicated in the chart, 85$ and 62$ where strong buyers will probably show up.

UPDATE October, 3
BTC/USD bottomed out at 109.7$ very close to the VWAP that provided support as i was expecting yesterday, the question now is whether this is a high volume breakout that portends much lower prices, or a high volume shakeout that will quickly be reversed. So far BTC/USD reacted from VWAP back to the first deviation line at 131$ and it is important now to don’t start to drift lower and lower in what i’ll call a secondary reaction that might end at 90$.

Since the market is still above an important moving average i’m plotting since july bottom at 65$ and trending higher since then, I am leaning towards the shakeout theory rather than toward the breakout theory. If I am right we shall see a rally back above the 131$ level during the next couple of days. Should we finish today or tomorrow above 140$ I think a substantial rally will have started.

Short Term Update: At resistance

UploadImageAs you can see from the attached chart on the left BTC/USD at gox is again probing the static resistance at around 147$.
It is clear from the chart that an ascending triangle pattern is forming with a projected target of 165$ that it’s exactly my long term target i’ve spoken about in this update . I think there is a chance to breakout September top at 149$ and reach 165$ or so during October.

I’m particulary happy of the recent news of a private Bitcoin Investment Trust for accredited investorst launched by Secondmarket, this might affect price significantly next year. Unlike the ETF that the Winklevoss twins have been trying to do, this one is only available to accredited investors and so it doesn’t have to pass the same exploratory process that a wider ETF would need to go through complex regulatory procedures. I can’t be sure but i smell a new big wave (the third after 2011 and 2013) of investors coming in 2014-2015, why? Well the bull market is coming to an end and instead of holding overvalued stocks many investors will eventualy explore new kind of investments like cryptocurrencies and Secondmarket Bitcoin Trust could be an easy gateway to invest in bitcoin.

Short Term Update: End-of-Month View

UploadImageNot much have changed in the last 7 days, this month tendency is obviously flat and not what i expect, basically the market is not going up as I would have hoped, I unfortunately bought on a false breakout of a strong resistance level and since then the market has been flat.

Short term picture is now a bit bearish because we are under this month VWAP (located at 137$) but still above the support at 125$. Before closing the position definitely i’ll wait to see BTC/USD under 125$ for at least one day.