Short Term Quick Update

chartThe recent sell off has brought the bitcoin into some notable short term support that I believe deserves attention. The top chart above shows the BTC/USD coming into support that is defined by the second deviation line of VWAP, computed using only last 7 days of data for a very short term indication.
The bottom pane of the chart shows the RSI in oversold territory but its average is higher because of the 5k bitcoins dump just happened at bitstamp.
It would appear to me that strong support in the near term, comes in around the $500-$520 price zone while resistance is above the VWAP, now at $590.

I don’t expect to see bullishness soon, i’m still looking for a long term bottom around $420.

Long Term Update: 3 days chart at Bitstamp

chart
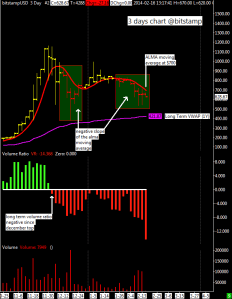
BTC/USD is trading beneath its 50 day moving average today as I write this, that average is now at $780. Coupled with the high volume on the downside, especially in the last 10 days,  this is solid evidence for a reversal of the short term market trend from up to down.

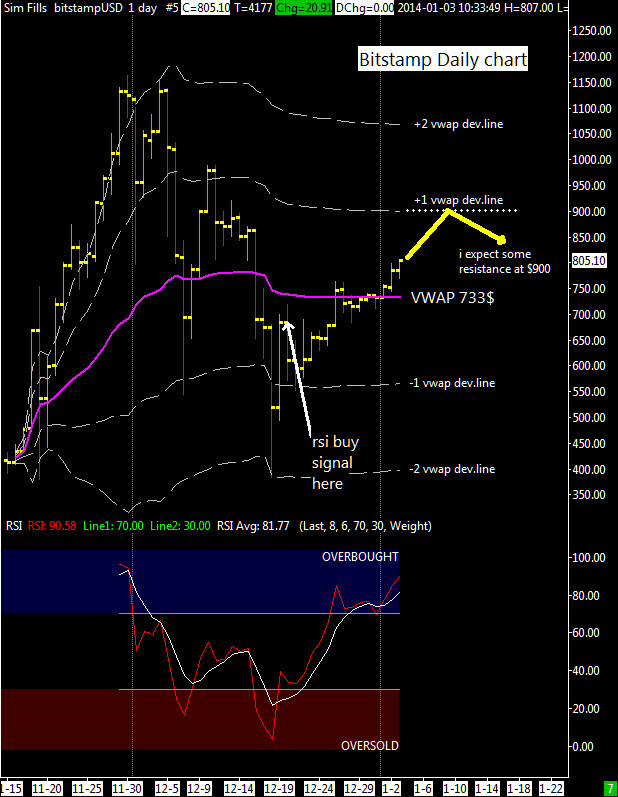
I think that BTC/USD will drop 200 dollars from here down to the long term support, my long term VWAP calculated using last one year of data.

If I am right about this the prognosis calls the bottom should develop as a conseguence of the MtGox drama, that exchange (if we can call it an exchange…) is almost out of business, my guess is that it is down of bitcoins and with strong manipulations of the price they are trying to recover the money lost due to the malleability issue from their own customers, this practice is of course totally illegal in a regulated market, i don’t want to go in the details but looking MtGox price and volume data there is a strong evidence of such activity.

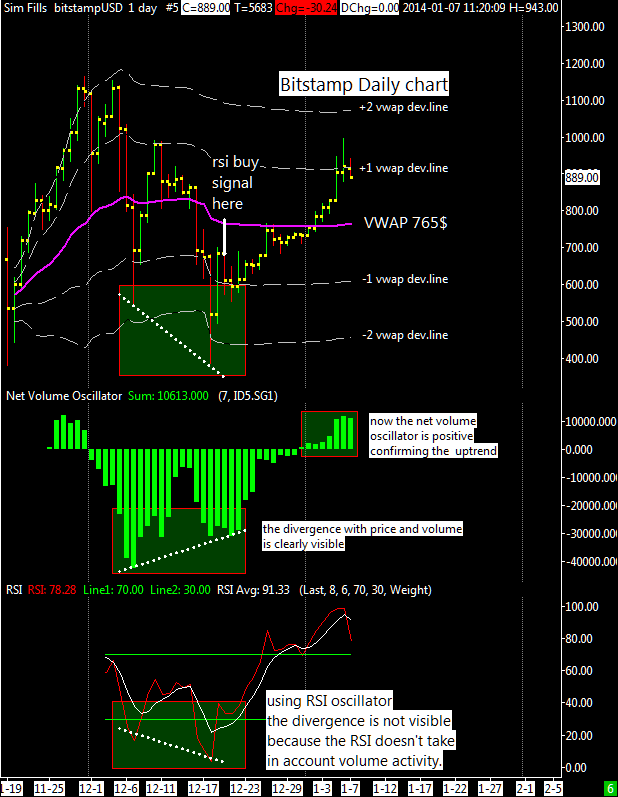
Back to our long term chart, is this the start of a bear market? I think it is too early to tell. The 200 day moving average is around my long term VWAP  so a drop under it would be the first clue that a bear market has begun. Also the other kind of average i use, the ALMA moving average, turned negative during the prolonged trading range of January.

I added a new indicator, similar to my “net volume” indicator, the only difference is that it computes the ratio between buyers and sellers and it has been remarkably accurate staying in bearish territory since November top; it looks good as a trend following tool.

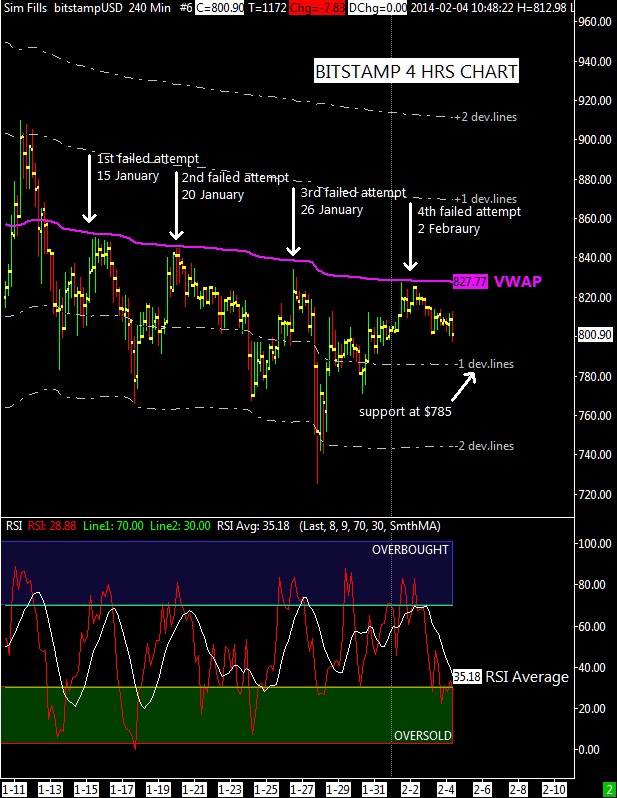
For the short term i think the price is now in a congestion in the $520-$720 price zone, a strong bottom where to shake out all weak hands is necessary and very healthy in my view and  if  this event will be accompanied by MtGox going out of business indefinitely, then the bitcoin market will be ready to move up again.
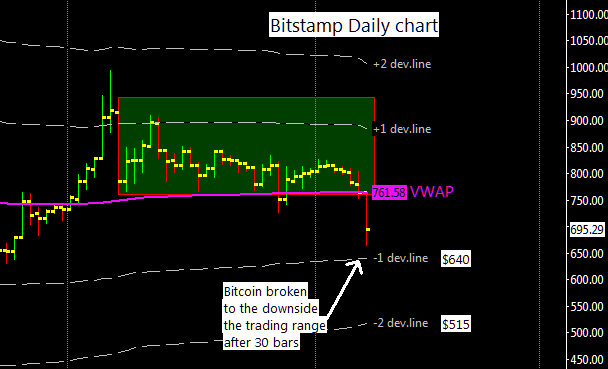
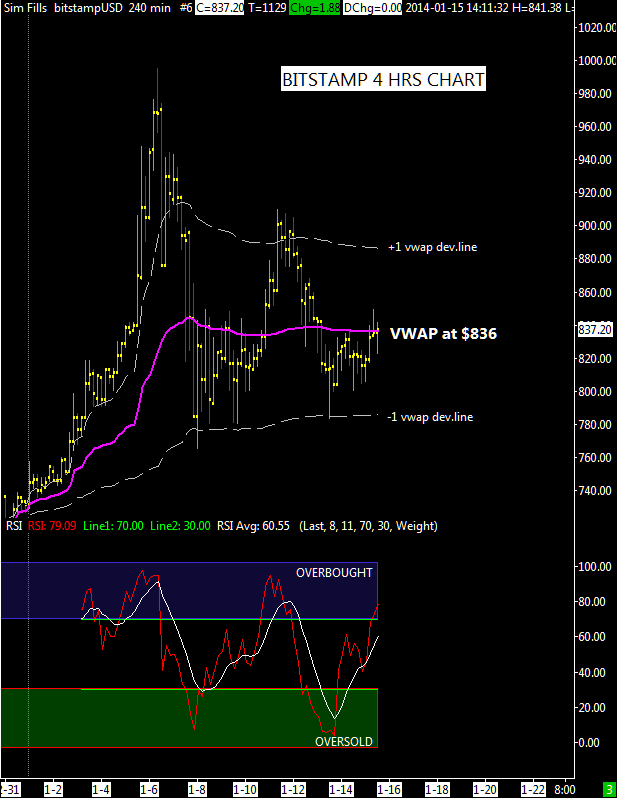
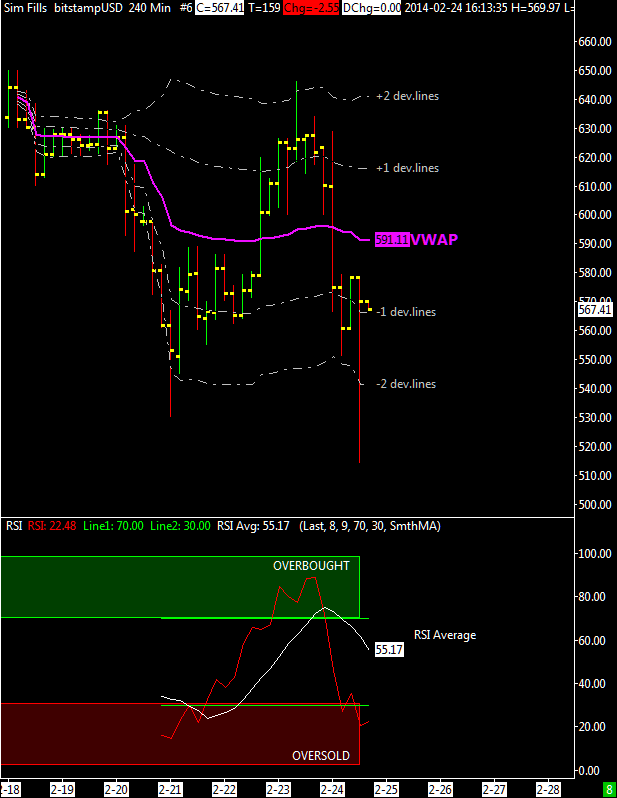
Long Term Update

As i thought the trading range has been broken after 30 days, it’s very unlikely to see more then that for a market congestion and with no exception this market respected this common rule. For the majority of the time prolonged trading ranges resolve with a strong break to the downside once the smaller trading ranges are broken.

chart

I’ve now two support levels, 640 and 515 dollars for the short term and i think that in this price zone some buyers will show up. For the long term supports are on my long term VWAP ($400) and the 200 days moving average now at $420.
Many are arguing that we are falling because of MtGox, i don’t agree with this view, it’s just an excuse to sell we all know that MtGox is out of business since months. When the market is in low sentiment regime good news are ignored and overreactions to bad news from investors are common.

Short Term Update: Bitcoin blocked in a trading range

chartThe BTC/USD at bitstamp exchange has been trying to bottom, but has been blocked in a trading range since 7 January ’14. There have been several attempts to move above the short term VWAP without success, every time my average halted the price advance; this means we have an accurate dynamic level that help us to understand when to enter this market: at the breakout of that level (now located at $828).

I think that if the weakness will continue in the coming days, we could see a low near $ 785, where there is the first negative deviation  line. RSI average is close to oversold, indicating that a bottom is near.


Short Term Update: News which moves the Market

chartBitinstant CEO Charlie Shrem has been arrested today in New York and charged with conspiring to commit money laundering. Well i think that we have just seen a strong shakeout after a bearish news for bitcoin (actually i consider it a positive news, i don’t like to see bitcoin associated to criminal like money laundering) with a sudden move down to the second deviation line of VWAP at 750 dollars.

I don’t think this news is enough to sink this market to much lower price levels, the congestion phase should continue with the short term VWAP moving average acting as resistance, now at ~$830.

I pointed out in the attached chart several occasions where BTC/USD failed to move above my reference moving average confirming the weakness of this market. The Net Volume activity was positive but turned negative after the news came out this morning.

We are in a price congestion and as long as the market stays inside my trading rage of $760-$920 the considerations i’ve made in my previous update are still valid and don’t forget that good resilience against bad news is always a positive sign.

Long Term Update: Congestion

chartCongestion occurs when four consecutive bars open or close within the range of a “measuring bar”. A “measuring bar” becomes such when its price range contains the opens or closes of at least three of four subsequent price bars. As i said in one of my old post sideways price movement may be broken into three distinct and definable areas:

  1. Ledges – less than 10 price bars
  2. Congestions – 11-20 price bars
  3. Trading Ranges – 21 bars or more with a breakout usually occurring before the thirtieth bar

Now 13 days are gone without a breakout above or below the “measuring bar” (i consider the bar of last 7 January the measuring bar) and we are in a congestion; I don’t think the market is still following the triangular descending pattern that I mentioned in the previous update.

I expect to see a breakout in the next 5-10 days, unlikely that this congestion will last more then 20 days in a volatile market like this. Top of the congestion rectangle is the first deviation line of VWAP around $930, while the $765 static support just below the VWAP defines the bottom of the trading range.

I think that without a really bad news investors will not sell their precious bitcoins under $750, I believe that the positive sentiment of the market will slowly push prices higher outside the current congestion, possibly above $900 and toward new highs but this process will require some time.


Short Term update: H4 chart @bitstamp

chartThis is a four hours chart of this month, it is visibile a descending triangle pattern forming up. Well i’ve read here and there about this pattern with lots of people worried about it, but usually this is a dangerous pattern when there is a clear downtrend and it’s not the case here, we are in an uptrend since last 18 December.
There are instances when descending triangles form as reversal patterns at the end of an uptrend, but they are typically continuation patterns.

Regardless of where they form, descending triangles can be considered bearish patterns that indicate distribution but, at the moment, i don’t see a strong negative lecture of my daily “net volume” indicator, instead it is improving.
Second thing to consider is that this month we have had many positive news, also today the French Senate hearing on bitcoin has been positive, in my opinion.

This triangle is going to complete itself before next 20 January, before this date it will break somewhere below my strong support at $785 (where there is also the daily VWAP) or above the descending trendline that defines the triangle, for the next days around $860.
Both levels are near vwap deviation lines of the short term 4 hours chart here attached.

As usual, I’m open to questions and comments, thank you.

Long Term Update

chartThe market in the last few days has done what I was expecting, it hesitated and dropped down to the support, the VWAP positioned at $ 765, here it slowly climbed back up to $ 900. Now we have two resistances, 920 dollars and 1067. 

I expect a little more resistance to advance this time but if it passes the psychological threshold of $ 1,000 it could also go beyond 1067$ (second deviation line of vwap) and it might try to attack recent all time top at 1163$.
The “net volume” oscillator  has been a bit  weak lately, at the end it can be considered neutral and is not yet seriously a danger to the current rise of prices.
For those who are invested for the long term I suggest to keep your position open for now. Stoploss should be positioned below long term VWAP now at 375$.

Long Term View: again on price divergence

chartA couple of days ago one of my reader asked me about price and volume divergence, i decided to answer to him with this post talking again about it.

All the readers that follow me since 2011 know that i use a “net volume” indicator to understand the activity of buyers and sellers, it is computed taking the difference of a security’s uptick volume minus its downtick volume over a specified period, here i compute it on a daily basis with a 7 bars summation  (an entire week because it’s a daily chart). 

Often traders use such an indicator to judge the momentum or trend of a security in order to make assumptions about its future price movements. Net volume is an indicator that is also very similar to the idea of money flow and its indicator, the money flow index.

Now BTCUSD is hesitating around a price resistance (first positive deviation line of VWAP) but net volume is positive and till it remains positive i do not expect to see stronger down movements in the price, although we might see some consolidation beetwen the VWAP at 765$ and the actual price of $900.

Long Term Update: daily chart @bitstamp

chartWhat we are seeing is a decent rally that it is still emerging from a severe December drop; i expect to see some resistance around the first deviation line at $900, it’s the same deviation line that marked the top at $980 before the crash down to $382.

The RSI oscillator is overbought,  when this occurs, the Market almost never makes a final high. That means the Market will most likely go higher in the medium term so it could be a good idea, for anyone wanting to buy into the currency, to buy at market and place a stoploss below the current VWAP level ($733).

The net volume activity is positive, finally, after more then 30 days of bearish volumes; it’s a first confirmation that the BTC/USD is headed towards further highs.

Outlook for 2014

Bitcoin is exiting a short term correction and it is projected to rise through 2014 as clear potential for growth is still intact despite an earlier warning issued by the Chinese central bank has banned its financial institutions from dealing in the currency. I’m confident that bitcoin can become a solid solution payment for electronic commerce and be a serious competitor to other money transfer providers; bitcoin should also continue to emerge as a viable alternative for investors around the globe interested to invest in a new financial asset where to store wealth.

I think that for this year the $350 price level is an important support, just below recent low of $382, for two reasons:

  1. Using bitcoin historical volatility i’ve $350 as support computing the value with my estimation method based on time and price volatility;
  2. Long Term VWAP computed since January 2013 is at $355

The maximum yearly upside target for 2014 should be around the $3000-$3500 price zone, in accordance with my previous long term forecast of $3600. It is a good opportunity for who is interested to invest in the bitcoin to buy something now and to set an indicative stoploss below $350.
Personally, i’m not going to liquidate my long term reserve of bitcoins as long as the price stays above $350 this year and i want to see the price for weeks below that level before any liquidation takes place, a quick drop below it isn’t enough for obvious reasons.

Short Term Update: 4hrs chart @bitstamp

chartThis is the chart from the $382 low of December 18, 2013; the VWAP is calculated starting from that bottom. It’s interesting to see how the RSI buy signal of December 22  is to be interpreted as a nice buy signal because the price was above the VWAP and it was forming an higher low.
The bearish signal of yesterday from $734 came after an higher high at $765 compared to the previous High at $720, i can conclude that the short term the trend is up but not so strong because of weak buying volume activity.

However i’m not much convinced to open long positions right now because I don’t see a strong positive rate for the volume activity, the net volume improved a bit and it’s almost neutral, a sign that now there is more balance between buyers and sellers, but we are certainly not at the levels seen during the strong uptrend of last November. I’m not saying that it’s forbidden to trade in the short term but you have to be extra cautious opening long positions when the volume is not supporting too much the rise.