Long Term Update: again Congestion

As i said recently, a congestion occurs when four consecutive bars open or close within the range of a “measuring bar”. A “measuring bar” becomes such when its price range contains the opens or closes of at least three of four subsequent price bars,  I consider the daily bar of last 27 April the measuring bar with the range from $430 to $460.

We can say that it is a congestion because we have been inside the measuring bar for 18 daily bars, more then 20 bars it is a Trading Range with a breakout usually occurring before the thirtieth bar.

I expect to see a breakout in the next two weeks also because of what i wrote about the length of the correction started in December ’13; I think that this congestion will not last more then 30 days in a volatile market like this. Top of the congestion range is also the one year VWAP now at $460.

chart
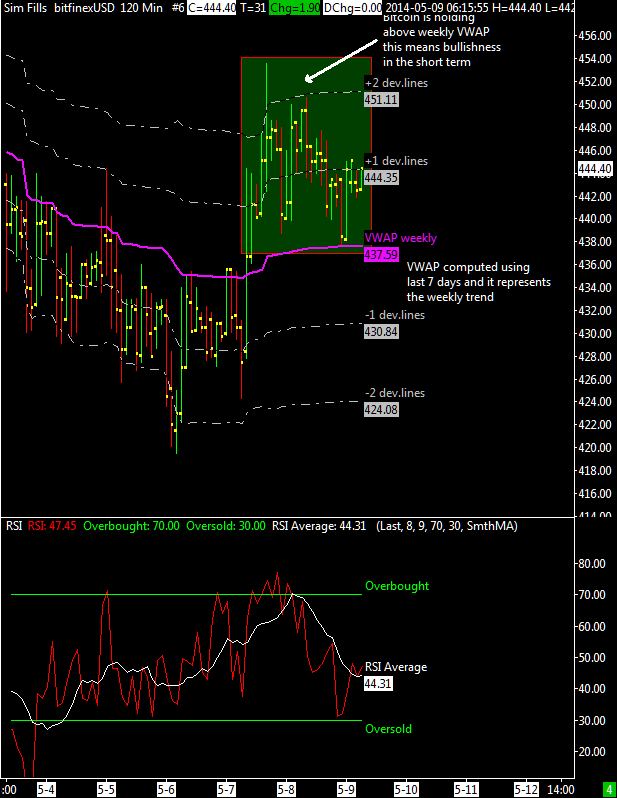
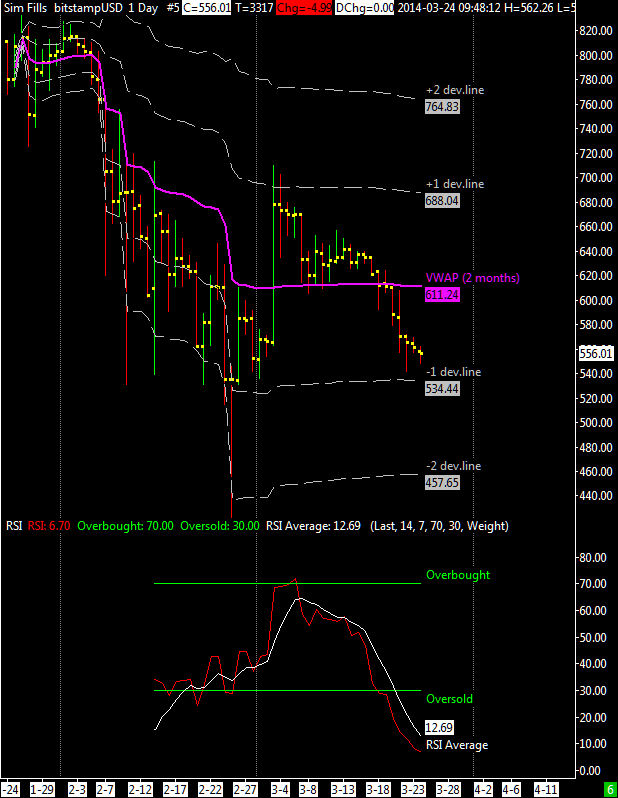
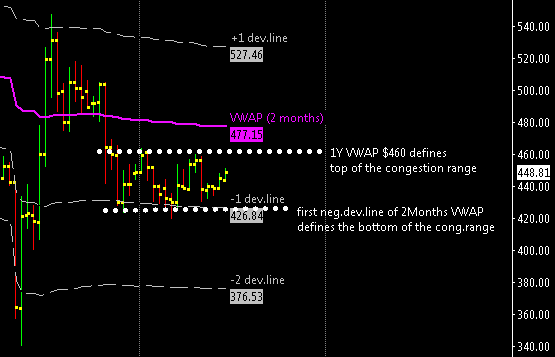
If XBT/USD will break below the congestion range, i still think that the $370-$390 price zone will provide some support.


Short Term Update: H2 chart at BitFinex

chartSince my last short term update XBT/USD topped at ~$460 and retraced back to the weekly VWAP, the RSI oscillator is oversold now so i’ve to conclude that there will be a new upswing from here.
Well when it is too easy there is always something wrong, i think there could be a further drop to the first support line at $430 before we see any upside; don’t forget that $427 is also the first negative deviation line of the 2 month VWAP, i think that for the next days this price zone should hold (around $425-$430).

For all the readers of this blog that likes to do short term trades i recommend to watch out that support area i mentioned before with the idea to close at or above $440, in any case it’s better to use a tight take profit because of the overall picture not yet bullish.
The stoploss should be tight as well, if this market breaks below $420 better to quit the position or open a short position up to the next support at $375-380.

Short Term Update: bitcoin is showing some sign of life

chartThis is a four hours chart using BitFinex, i’ve decided to move there but it’s a temporary decision, i’m not particularly ecstatic about an exchange that used the stolen code of bitcoinica as a starting point. I decided to ignore hitbtc because they are blatantly faking volume activity since mid april; an unfair practice that i really hate. I’m currently exploring also ItBit, the Singapore based exchange, it could be my next choice.

XBT/USD is showing some sign of life after it moved above the weekly VWAP, it could be the first step for a long term reversal as long as it stays above $440. I’ve noticed that also the weekly net volume recovered from a very bearish situation back to neutrality and the two months VWAP is not so far, currently at $480.

Many investors and traders are waiting a further drop below $400 and possibly lower, a couple of weeks ago i was waiting a drop to $300 but the market stopped at $340, at this point I’m not so sure that this market will satisfy us with a further drop considering also what i’ve said in my previous update about the length of this correction started last December. I smell the possibility of a market upmove coming soon and against the expectations of all with the effect of surprising everyone.

Time is running out

I report  an analysis that take an historical perspective of the XBT/USD, using MtGox data for the period before the inception date of the Bitstamp exchange. The effort of this short analisys is to understand how much it’ll last the current decline in prices started 5 months ago.

I reported here all the most important past swings of this market, not always considering the absolute highs and lows but the upward and downward phases of the market which can include periods of sideways activity.

The earliest days

In 2010 the main exchange was MtGox, it opened in July but available data starts from 17 August.
Up to the first days of october the price stayed flat at $0.06 then rised significantly to $0.50 the 7 November. A correction followed with a low at $0.17 after 32 days.

The next swing carried bitcoin from 17 cents up to $1.09 (9 Feb. 2011) and again a correction, longer this time, 54 days down to 56 cents, it was april 2011.

The First wave

Everyone here probably remember the insane upswing that went from below 1$ up to 32$ of  June 2011, from this top bitcoin entered a bear market that lasted 162 days, till november 2011 where it bottomed out at $1.99

From this bottom a new upswing happened up to $7.2 (8 Jan ’12) , again similar in length to the previous ones: 52 days. This market then stayed sideways for 145 days, when the first days of June a new uptrend moved bitcoin up to $15.4, in August ’12 after 77 days. For the second time in a year we have had another phase of  flatness prices that lasted 139 days similar the previous one of 145 days.

The second wave

The first days of 2013 another upleg started from $13 up to $266; 97 days the longest upswing ever for bitcoin. After a period of huge volatility till July of the same year , prices stabilized at around 100-120 dollars and this consolidation ended 12 October after 185 days. So far we have had 6 consolidations with an average duration of 126 days or 158 days without considering the earliest days of bitcoin.

The last wave

This is the latest part with the solid rise from 140 dollars of October ’13 up to $1163, the bitstamp all time high done 49 days later. Since then 156 days are passed and comparing this value with past values i believe that the actual consolidation phase is coming to an end.

Eventually this correction might last as the previous one that lasted 185 days, this will project the end of the actual correction phase something around June 2014, one month from now.
Beware that this forecast doesn’t necessarily means that a new bottom will develop because as i said earlier i haven’t considered absolute bottoms in calculating the duration of all the past price consolidations; it just means that probably during next June a new uptrend will start.

Time will tell.


Quick Update

This market has stopped around the resistance price zone that I had speculated in the previous update (around $530) then resumed its downward movement. First support is in the area between 365 and 380 dollars, also because the 50% or midpoint of the previous swing from 340 to 548 dollars ($ 444) has already been broken down, which is certainly a bearish sign.
I believe that we will continue to see a decline in prices this week too, the main resistance is always the two month VWAP passing at 517 dollars.

LongTerm Update: daily chart @bitstamp

chartThe market reacted from the recent low of $ 340 , because of this I think it is better to look more closely at the VWAP calculated with two months of data instead of a year, why? Well because long term VWAP is no longer functioning as a support , for this reason we will put it aside for a while.
After a prolonged decline , from 710 to 340 dollars, where the market has lost almost 50% , I believe that a rebound in prices is due and it should reach the mid-point of this bearish swing up to about $ 525 .
It is not a coincidence that at $ 535 there is the average VWAP now calculated with two months of data, consequently i think that up to $ 530 would be a normal rebound in a bearish market phase.
The RSI oscillator is recovering and when the market will reach the $ 530 price level probably the oscillator will be in the overbought zone , this could lead the market to stay lateral around the resistance to subsequently resume to fall.
In any case the volume has the highest priority above these analyses based on the VWAP and its price levels , as well as the RSI oscillator; if you begin to see a positive ratio between volumes made on uptick and downtick  then it will probably be the confirmation that a new uptrend has started, regardless of what price levels and oscillators tell us if buyers come back it is imperative to follow them.

To conclude, if i finally see a positive volume ratio (computed as usual on the 3 days chart) and a market moving above $530 i’ll open a long term trade, initially with half position and then moving to full position once i see on the 3 days chart my ALMA moving average turning positive. The stoploss will be tight because the final confirmation of a long term reversal there will be once the market will move above last top, located at $710.

Long Term Update: next stop $300

chartXBT/USD is making further downside progress below the 1-year VWAP and at this point i think that the breakout is confirmed, a move should follow towards the old April 2013 Top at $266.
I think that at $300 there will be a strong support because of the first negative deviation line of the VWAP and to reach this level, looking the bitstamp order book, we need approximately 15k bitcoins.
Adding this value to the current weekly net volume we have -25k bitcoins, a value that looking the past should provide support to the price action, a rebounce should follow from $300.

To conclude, now we are at the baseline of the giant descending triangle and it looks ominous.  It can break either way but usually downwards (70%-80% of the time) as i said in my previous update.


Long Term Update: at support

chartIn the last days XBT/USD started to break below the long term VWAP (~$445) and if it makes further downside progress the breakout will become very obvious.
It would probably be followed by a move down to the old April 2013 Top at $266 confirming the giant descending triangle that it is forming.

Such a breakdown would be very bearish IF accompanied by a dropping network difficulty as happened in 2011 during the bear market.

As you can see in the attached chart that on the two previous tests of the VWAP (December bottom at 382 and february bottom at $400) the market reacted strongly and quickly instead this time it is spending too much time around the same support, this is an indication that probably XBT/USD is going to break below it.

In case of a confirmed break below $440 for this week support level should be around $330-$350, i don’t think that XBT/USD will go straight to 266$.

So far I have been talking about bearish potential. There is still a chance (probably 20%-30%) that this potential will not be realized and that new bull market highs lie ahead if XBT/USD stays above long term VWAP. In case of a reaction from here first resistances are at $550-$580.


Long Term Update: daily chart last 2 months @bitstamp

chartAfter failing to stay above my weekly moving average ($616) and VWAP computed using last 2 months ($611) the XBT/USD moved back to a short term downtrend with a lower top at $631 (12 March) after the previous one of $710 (3 March); supports are now at $534 and $457 as indicated in the attached chart.

RSI is very low, very oversold and at this point i’d like to see a decent reaction at least up to the VWAP at 610 dollars but i’m not so sure about it because of the overall bearish outlook on a weekly basis. I think that the market might break below the 541$ recent low because of a big descending triangle that it is forming on the weekly chart, and moves all the way down to the $440-$450 price zone where i think strong buyers will come back for a new buying opportunity.


Bearish Scenario
If this market decides to move well below my long term $440 support I think it will spend there the right amount of time required to scare weak investors, forcing them to sell their bitcoins to long term experienced investors.
Where? The final bottom should be probably above the April 2013 top at $266 but as long as XBT/USD stays above my $440 long term VWAP support this bearish scenario remains only an hypothesis.

Long Term Update: 3 days chart @bitstamp

chartNot much happened since my last update ten days ago, the market volatility dropped a bit and XBT/USD is struggling to stay above 600 dollars. It is a characteristic of this market because it is composed by amateur investors they don’t have the patience to hold and after a while if nothing  happens they start to sell for eventually rebuying later. Aniway I summarize the situation as follows:

Bullish aspects:

  • Price above long term VWAP (now at $440)
  • Slope of ALMA moving average slightly positive

Bearish aspects:

  • Weak buying volume activity
  • Ratio between buyers and sellers is negative, and it has been so since December $1200 top
  • Market reactions to good news has been sluggish since january $1000 top on zynga and facebook news, this is not bullish, investors are reluctant to buy on good news.

Conclusion
I think that this market will need time to absorb the “huge confidence hit” because of MtGox fiasco but as long as it stays above the one year VWAP ($440) i’m not worried for a possible bear market coming. For who has been ruined by MtGox and its phenomenal CEO and wants to enter again in this market there are two possible strategies:

  1. buy now 100% of your position
  2. buy now 50% and the remaining 50% if bitcoin retest again my long term vwap around $450

Stoploss for both strategies could be a weak market going under $350-$400 for a prolonged period of time and a dropping network difficulty (currently on a strong rise).

Long Term Update: an improvement

chartSince my last update XBT/USD showed strength above $600 this means that the short term bearish trend is almost over but I need to see the upvolume/downvolume ratio computed on a 3 days chart becoming positive before opening a long term position.

Another positive aspect is that the ALMA moving average slope is now positive, an important bullish sign.  For an investor who wants to play very safe with their money i recommend to wait a confirmed bullish volume activity because, as I said before,  the up/down volume ratio is still negative; why? Well because it’s not enough a strong and quick spike up to $710 to erase weeks of weak market performance.

The intentions of the market to goes up must be confirmed with solid buying from investors but for who wants to try to anticipate the market i recommend to place a buy order in the $600-$620 price zone, in the short term this market should found support there, above the 3 days ALMA moving average now at $605.

Long term update: Bitcoin bottom is in

chartI attached here on the left a long term chart where each bar represents three days of market activity, as i said in the past this particular time frame is a good compromise between a weekly chart and a daily chart.
Despite the recent strong rebounce from my long term support around $420, the ALMA moving average is still pointing down confirming that XBT/USD is in a short term corrective phase inside a long term bull market because the price during last months has been always above my long term vwap, now at $430 and also above the 200 days moving average now at ~$470 and rising.

About volume activity the “volume ratio” indicator tell us that the situation is still very oversold and all the recent bearish news and the excess of pessimism among many investors let me think that probably the bottom is in but to avoid any risk before opening a long position is wise to wait a positive volume activity that should be back once a new uptrend is established and confirmed by the reversal to the upside of the ALMA moving average i use.

To conclude XBT/USD remains in a corrective phase inside a long term bull market, the rebounce should stop near $600 where there is the ALMA moving average to act as resistance level. Any strength above $600 could mean that the short term bearish trend is over and that this market is headed up again.