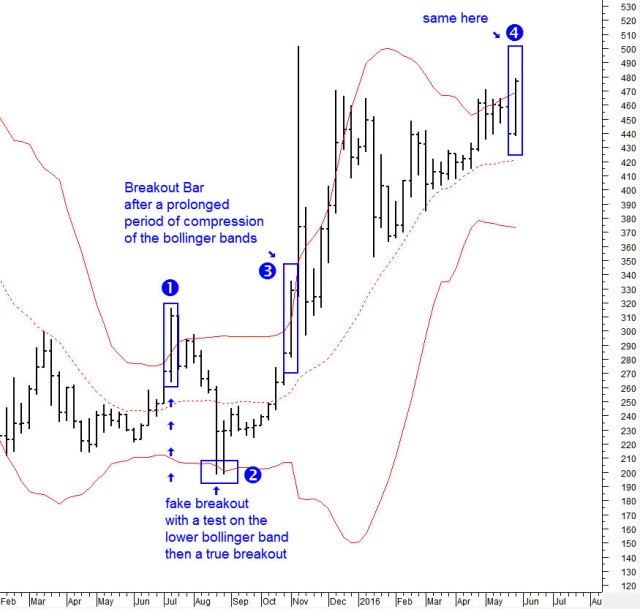
Monthly Chart
This is a simple monthly chart since Jan.2012, important facts are:
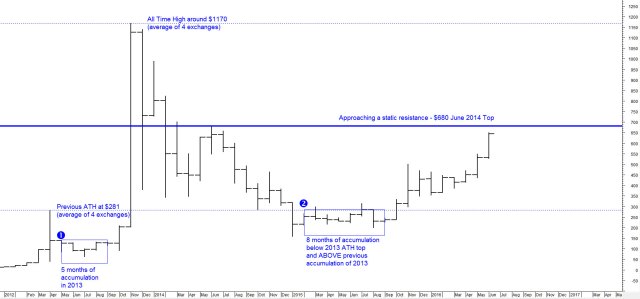
- Accumulation zone #2 is above previous one, #1 in the chart
- The static resistance at $680 is also the 50% of the price swing from the all time high down to the 2015 bottom at ~$150
As i explained in past updates the midpoint or 50% it is one of the strongest and most important resistance/support level. The main trend is obviously up (at least so far) because the low around point 2 in the chart is above point 1 thus is legit to expect a new all time high if this market can break above the $680 static resistance.
Furthermore the fact that the two accumulation zones highlighted in the chart never overlap tell us that the underline long term trend is very strong and because of this i expect a new all time high in case of a strong breakout above $680.
Forecasting resistances
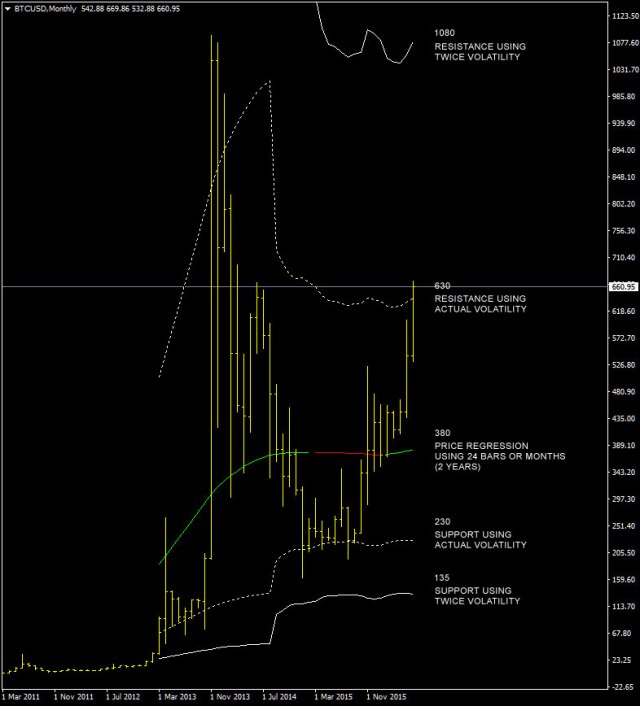
This is a template i use for long term analysis with metatrader 4 platform, first i compute a price regression with 12 or 24 bars/months with a monthly chart then i compute supports and resistances. Dotted lines represents supports/resistances using the recent volatility of XBTUSD, non-dotted lines are levels computed using twice the value of recent bitcoin volatility.
We are exactly at the resistance and this is very interesting because in 1-2 months we will see if bitcoin long term trend is still up or not.
I have taken in account the log-normal distribution of price otherwise i’d have had very bad results in computing the levels, usually it is not required but when prices movements are so high you have to. What does it mean? It’s simple, before doing any calculation first compute the natural log of the price, do your stuff and last reexponentiate the data to have back the price chart with a linear scale.
This is why i do not recommend to use standard bollinger bands with bitcoin on a long term chart, you would have bad results, sometimes with the lower bollinger band going negative! clearly unrealistic.

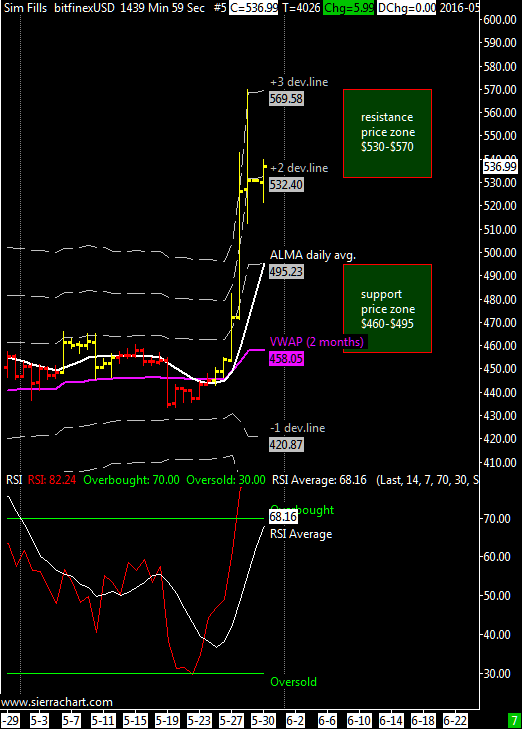
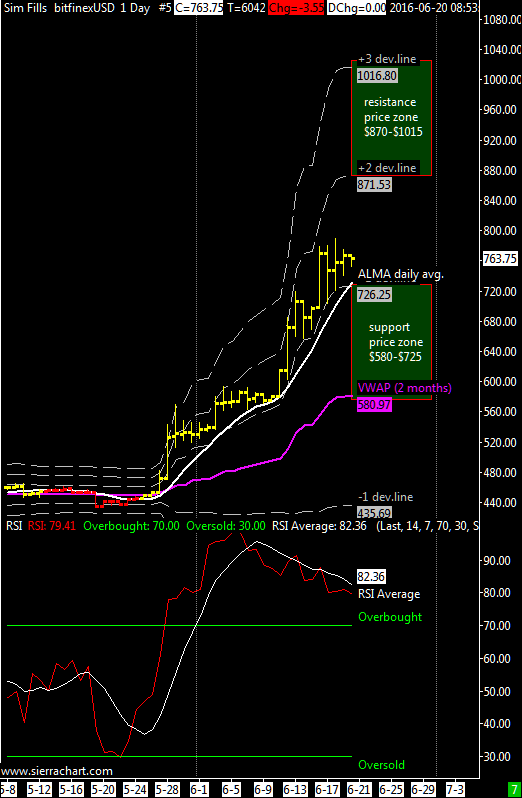 XBT/USD weekly range.forecast $725-$870 | daily moving average is bulllish and main support is at VWAP near $580. XBTUSD continues to stay all the time above the first positive deviation line of the VWAP, a bullish behaviour.
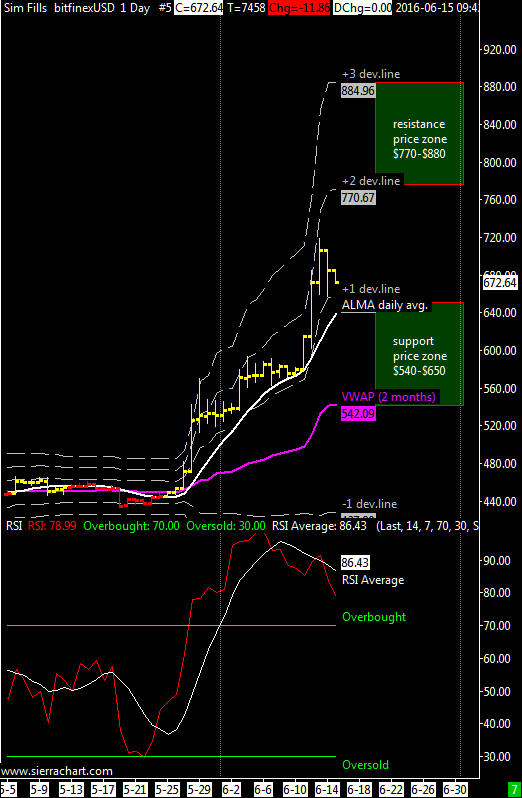
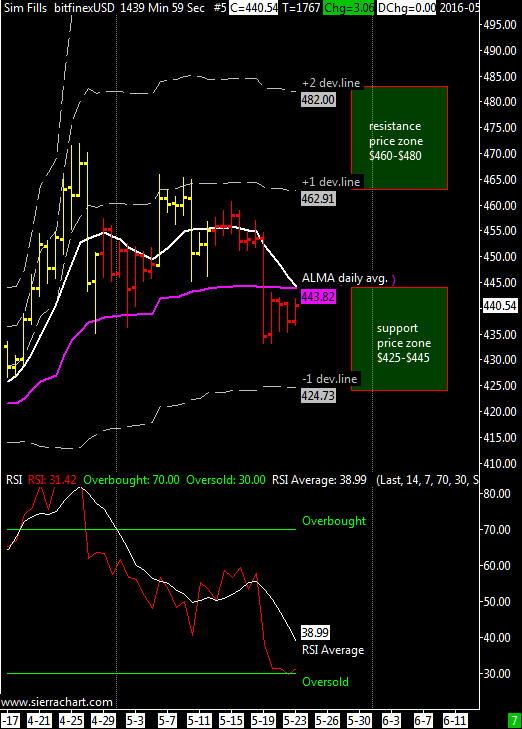
 XBT/USD weekly range.forecast $610-$800 | daily moving average is firmly bulllish and main support is at VWAP near $520 although when the market is strong usually the first positive deviation line act as main support; now at $615.