The Efficiency Ratio (from now on ER) was presented by Perry Kaufman in his 1995 book “Smarter Trading” and it is calculated by dividing the price change over a fixed number of bars by the sum of the price movements that occurred to achieve that change. The resulting ratio ranges between 0 and 1 with higher values representing a more trending market.
The idea here is to measure the value of the ER during an important Bitcoin Top to see if there is a strong coherence between different timeframes.
| Date | Daily ER | Weekly ER | Monthly ER | Average of 3 |
| November 30, 2013 | 0.70 | 0.79 | 0.64 | 0.71 |
| December 18, 2017 | 0.66 | 0.74 | 0.88 | 0.76 |
| January 8 , 2021 | 0.62 | 0.77 | 0.44 | 0.61 |
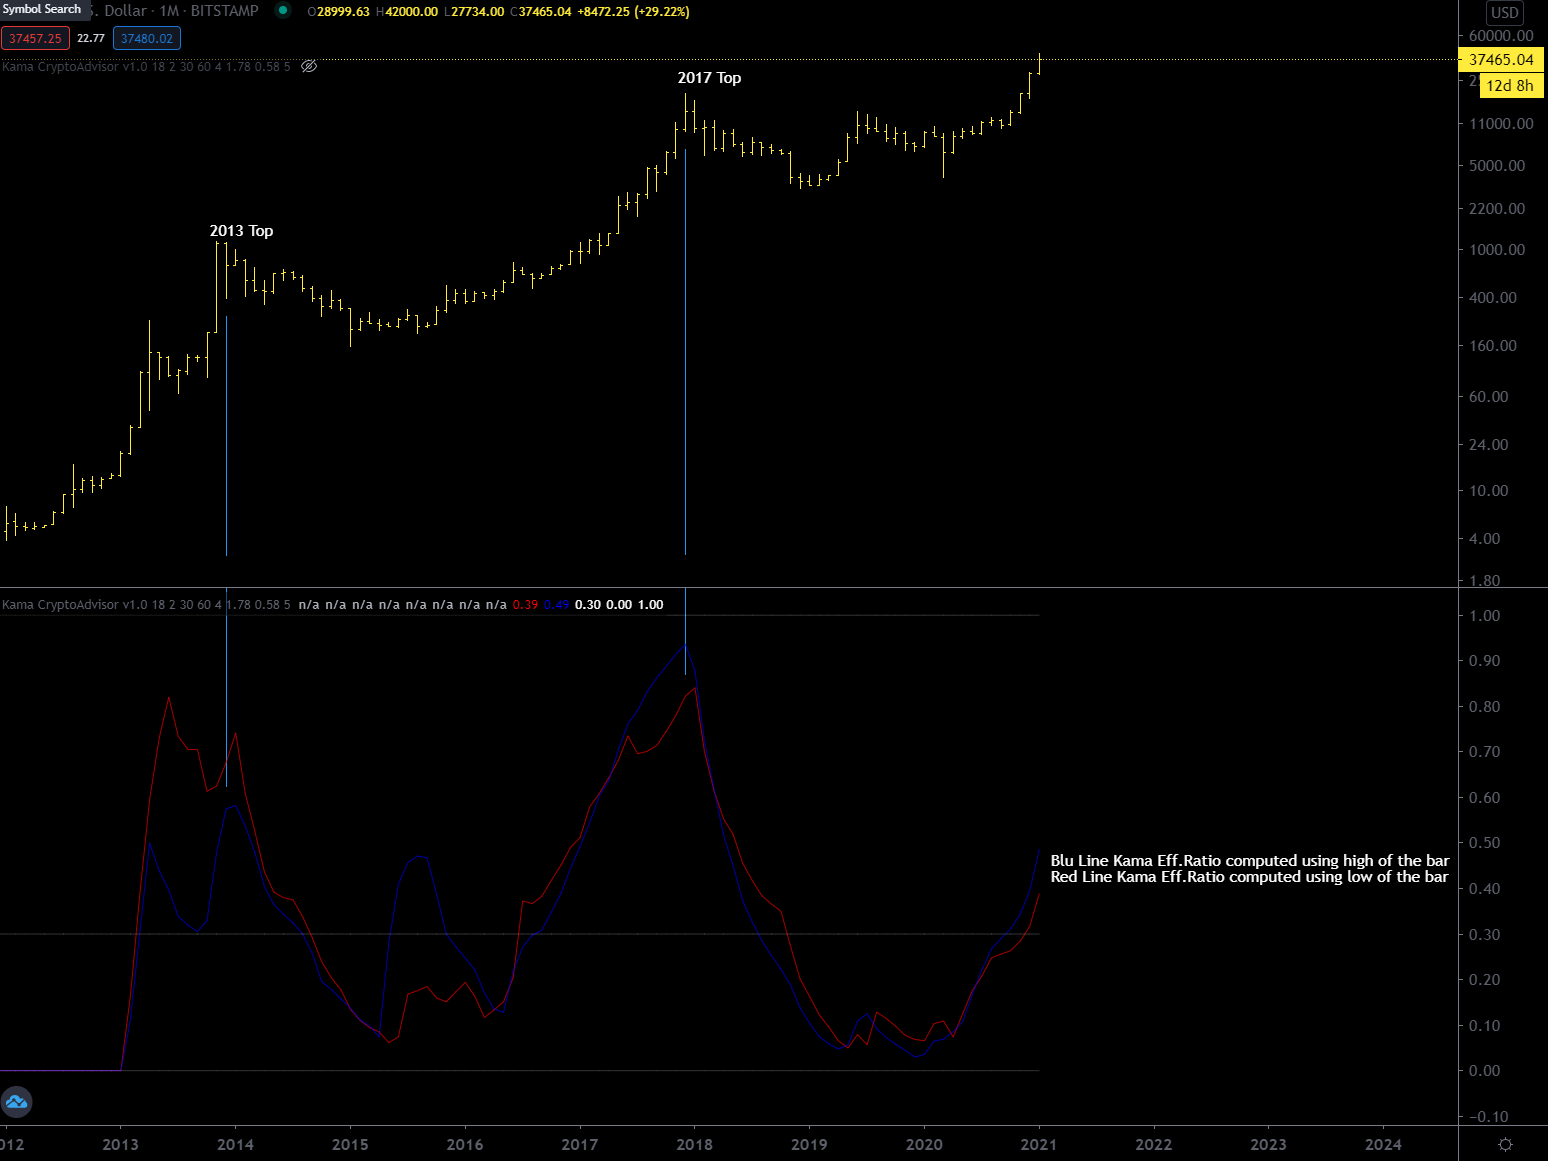
The high of last January 8 does not seem to have a situation on the various timeframes similar to that one of two important Bitcoin top (2013 and 2017), in particular the situation on the monthly timeframe is inconsistent.
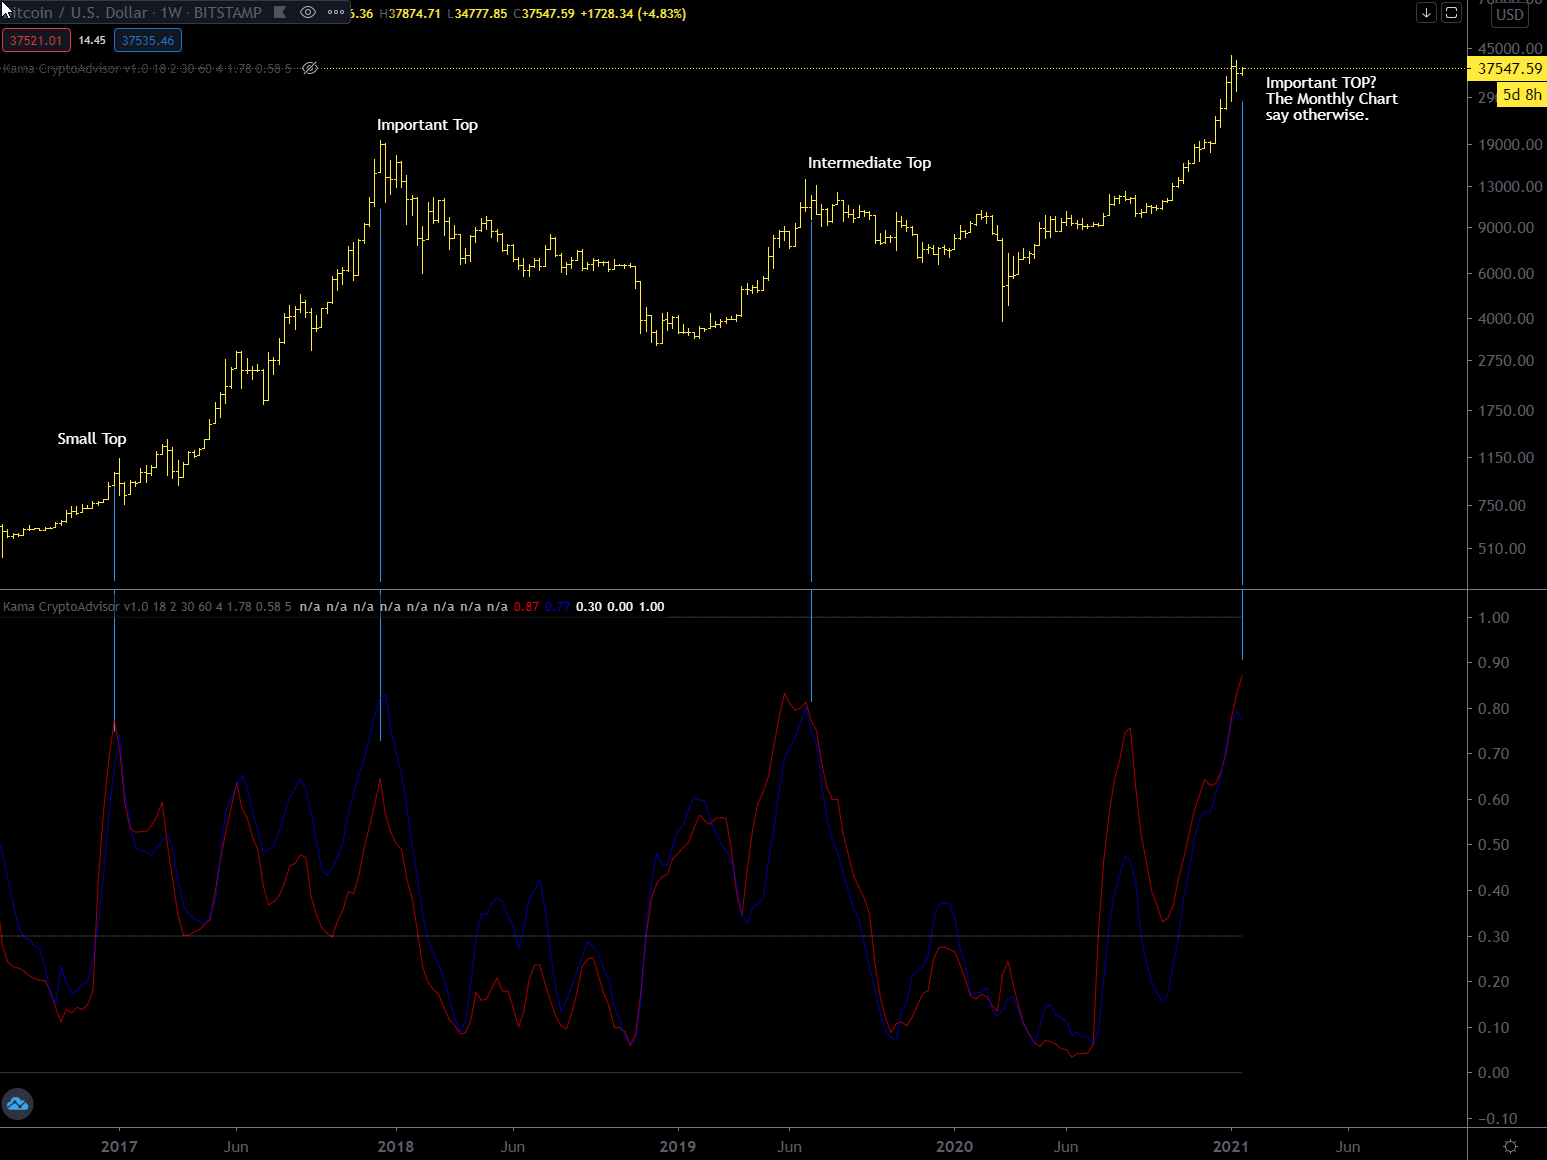
On the weekly timeframe instead ER is quite high but I think that in the end the monthly timeframe will prevail. It is always difficult to understand which timeframe dominates over the others but personally I prefer to give precedence to the highest timeframe, in this case the monthly where there is room to rise.
I attach below the weekly chart so you can better visualize the ER situation
And here the monthly chart where you can clearly see there is room for a prolonged trend.