
I didn’t expect such an intense drop, as a general rule when volatility increases you have to go up with the timeframe used, the 4 hour chart is not enough anymore.
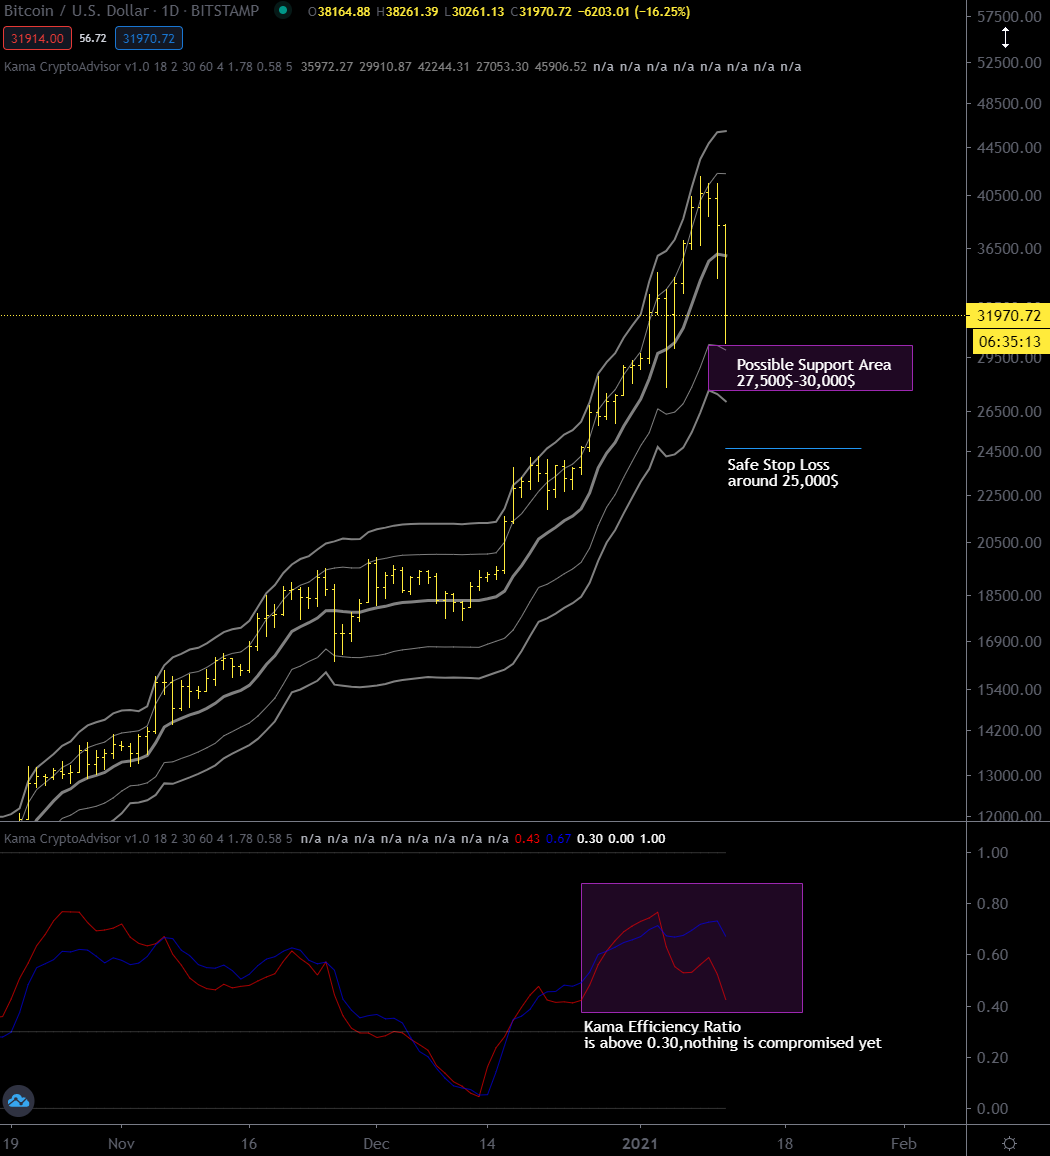
On the daily chart a correction below $30,000 would mean that an intermediary top has been made at $42,000 and that a more or less prolonged sideways movement awaits us before seeing new highs.
I am including below an updated daily chart.

safe stop loss – does it mean you are going to sell some of you BTCs when price drops below that level?
It is not an automatic action, i evaluate what happen around that price area. It’s much more important to see how long bitcoin stays there without moving back to the kama deviation bands rather then the price level. Time is much more important then price.
thx