I didn’t expect such an intense drop, as a general rule when volatility increases you have to go up with the timeframe used, the 4 hour chart is not enough anymore.
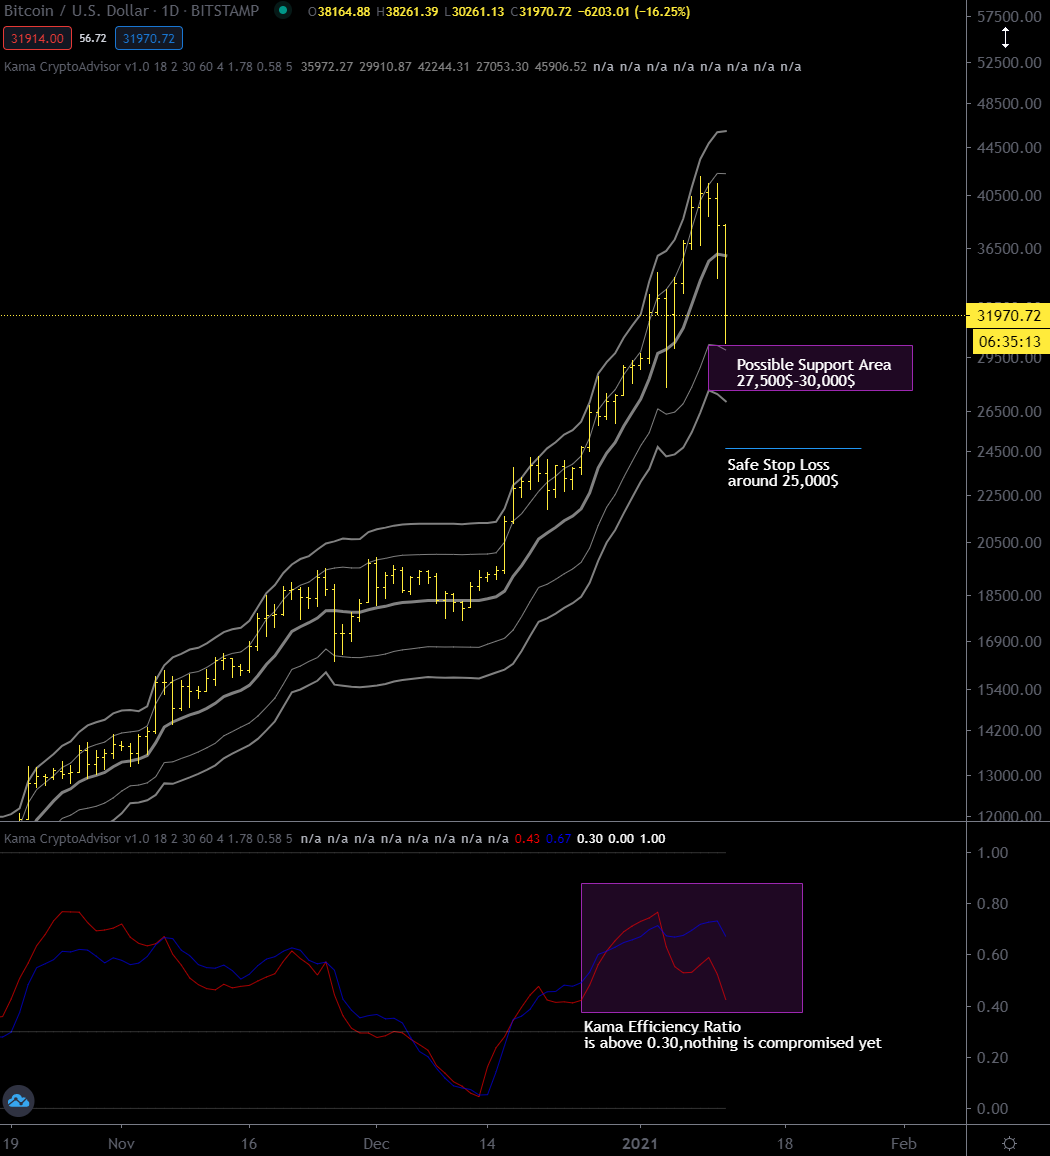
On the daily chart a correction below $30,000 would mean that an intermediary top has been made at $42,000 and that a more or less prolonged sideways movement awaits us before seeing new highs.
I am including below an updated daily chart.