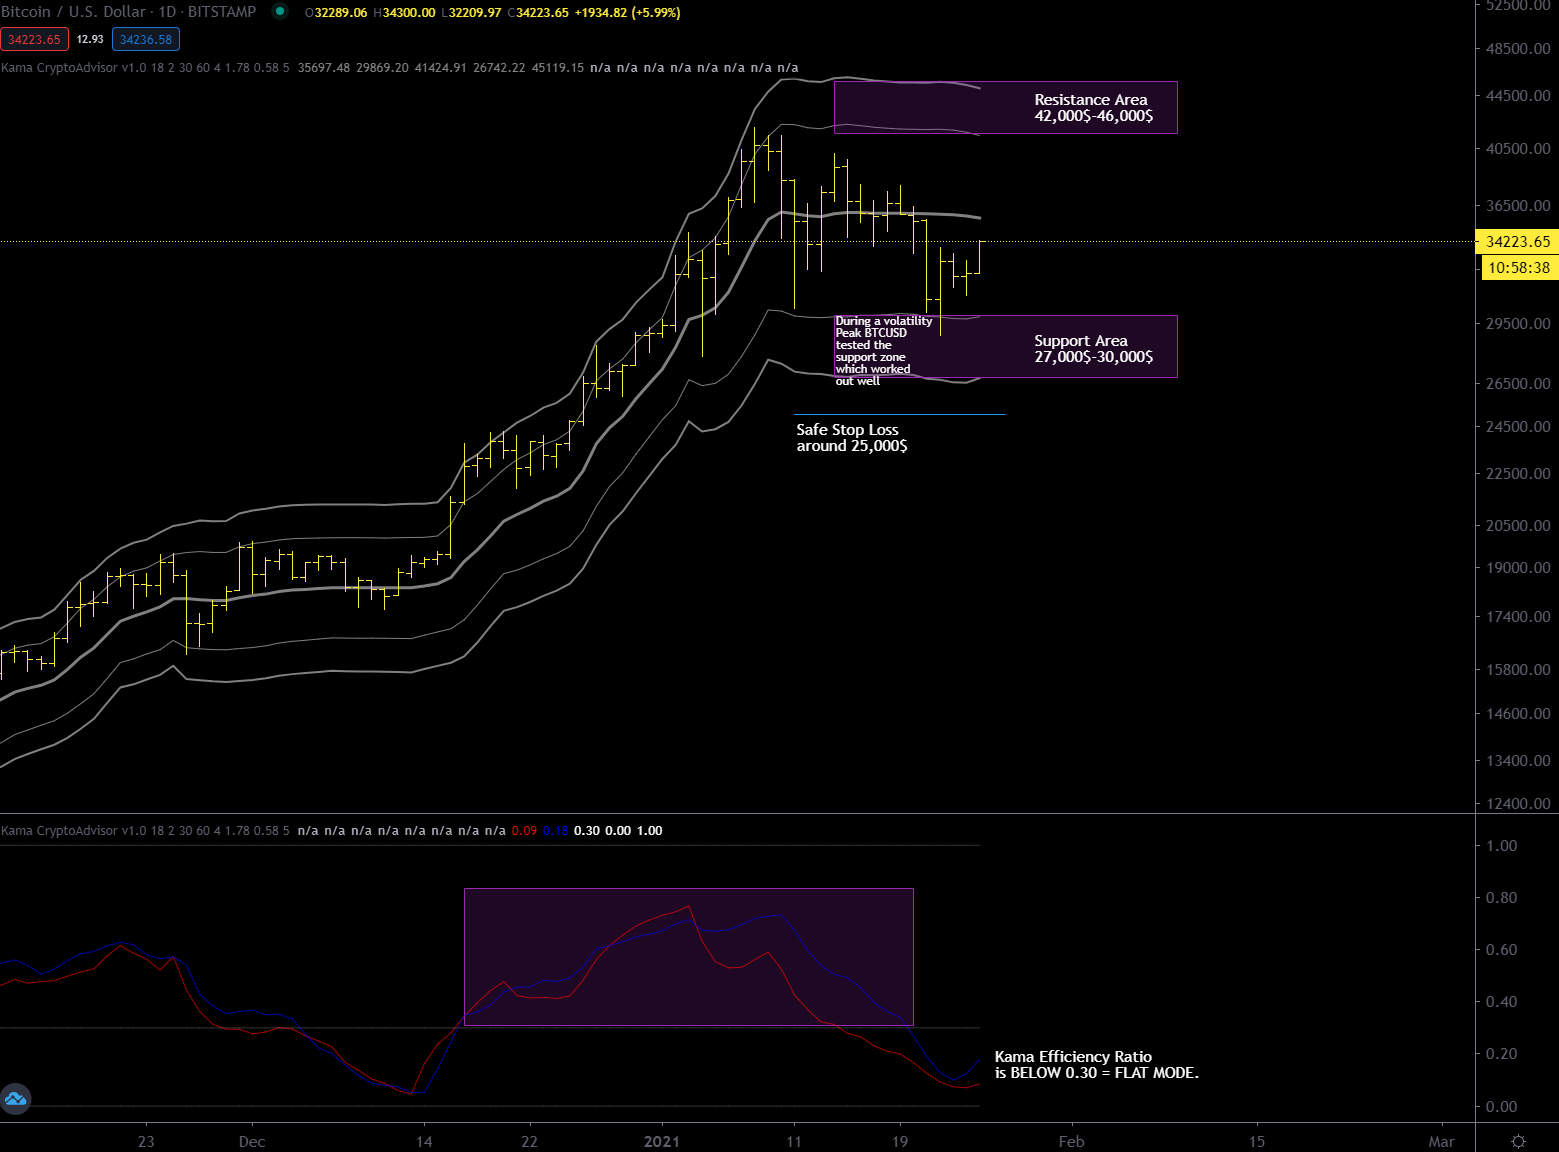
Since the last daily update bitcoin has gone into “flat mode” (kama efficiency ratio below 0.30), in this mode you can expect the oscillators to work fairly well so that the widespread stochastic oscillator gave you a nice buy signal a few days ago. I believe that today or tomorrow at the latest bitcoin is going to recover the Kama average at $35,900. It remains to be seen in which direction the kama efficiency ratio will confirm the next trend on the daily chart considering that the situation on the weekly remains a bit unfavorable to the bullish while the monthly one is not, as I said in the previous long term update of January 19.
BTCUSD Daily Chart – Kama and Kama efficiency ratio, 18 periods.
The Efficiency Ratio (from now on ER) was presented by Perry Kaufman in his 1995 book “Smarter Trading” and it is calculated by dividing the price change over a fixed number of bars by the sum of the price movements that occurred to achieve that change. The resulting ratio ranges between 0 and 1 with higher values representing a more trending market. The idea here is to measure the value of the ER during an important Bitcoin Top to see if there is a strong coherence between different timeframes.
Date
Daily ER
Weekly ER
Monthly ER
Average of 3
November 30, 2013
0.70
0.79
0.64
0.71
December 18, 2017
0.66
0.74
0.88
0.76
January 8 , 2021
0.62
0.77
0.44
0.61
Multi TimeFrame Kama Efficiency Ratio at Bitcoin Historical Tops
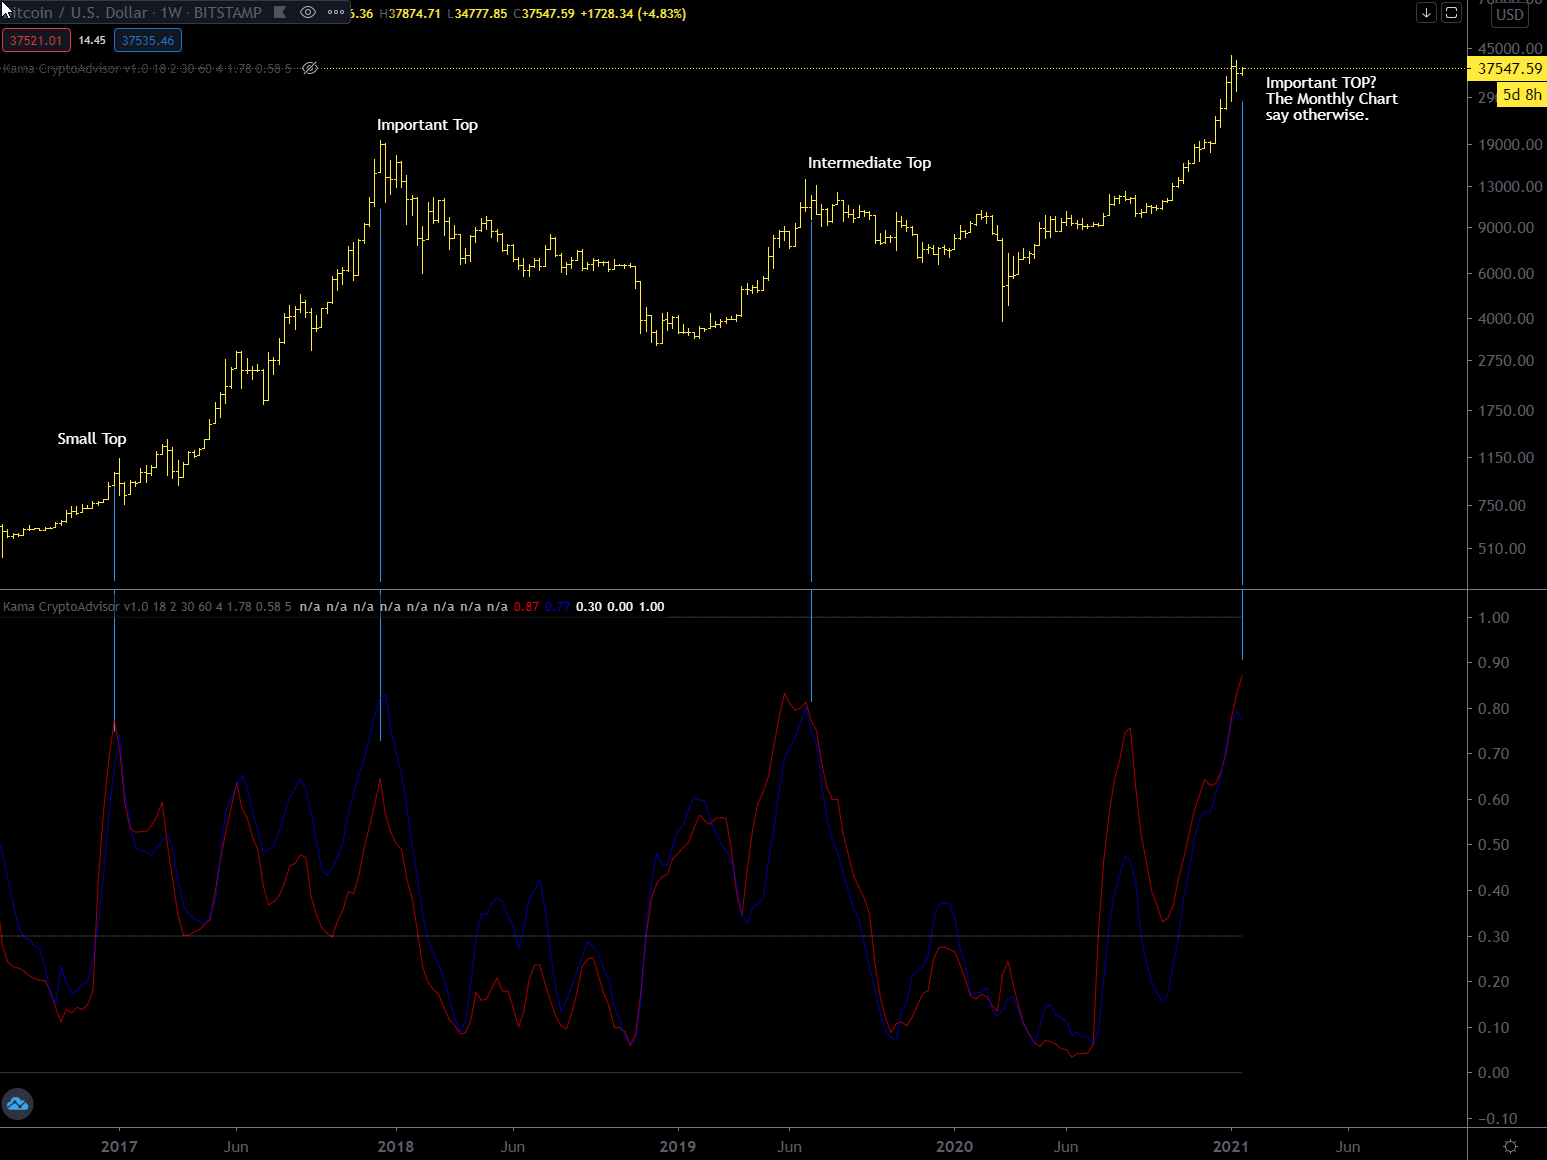
The high of last January 8 does not seem to have a situation on the various timeframes similar to that one of two important Bitcoin top (2013 and 2017), in particular the situation on the monthly timeframe is inconsistent. On the weekly timeframe instead ER is quite high but I think that in the end the monthly timeframe will prevail. It is always difficult to understand which timeframe dominates over the others but personally I prefer to give precedence to the highest timeframe, in this case the monthly where there is room to rise. I attach below the weekly chart so you can better visualize the ER situation
Weekly Chart BTCUSD with Kama Efficieny Ratio
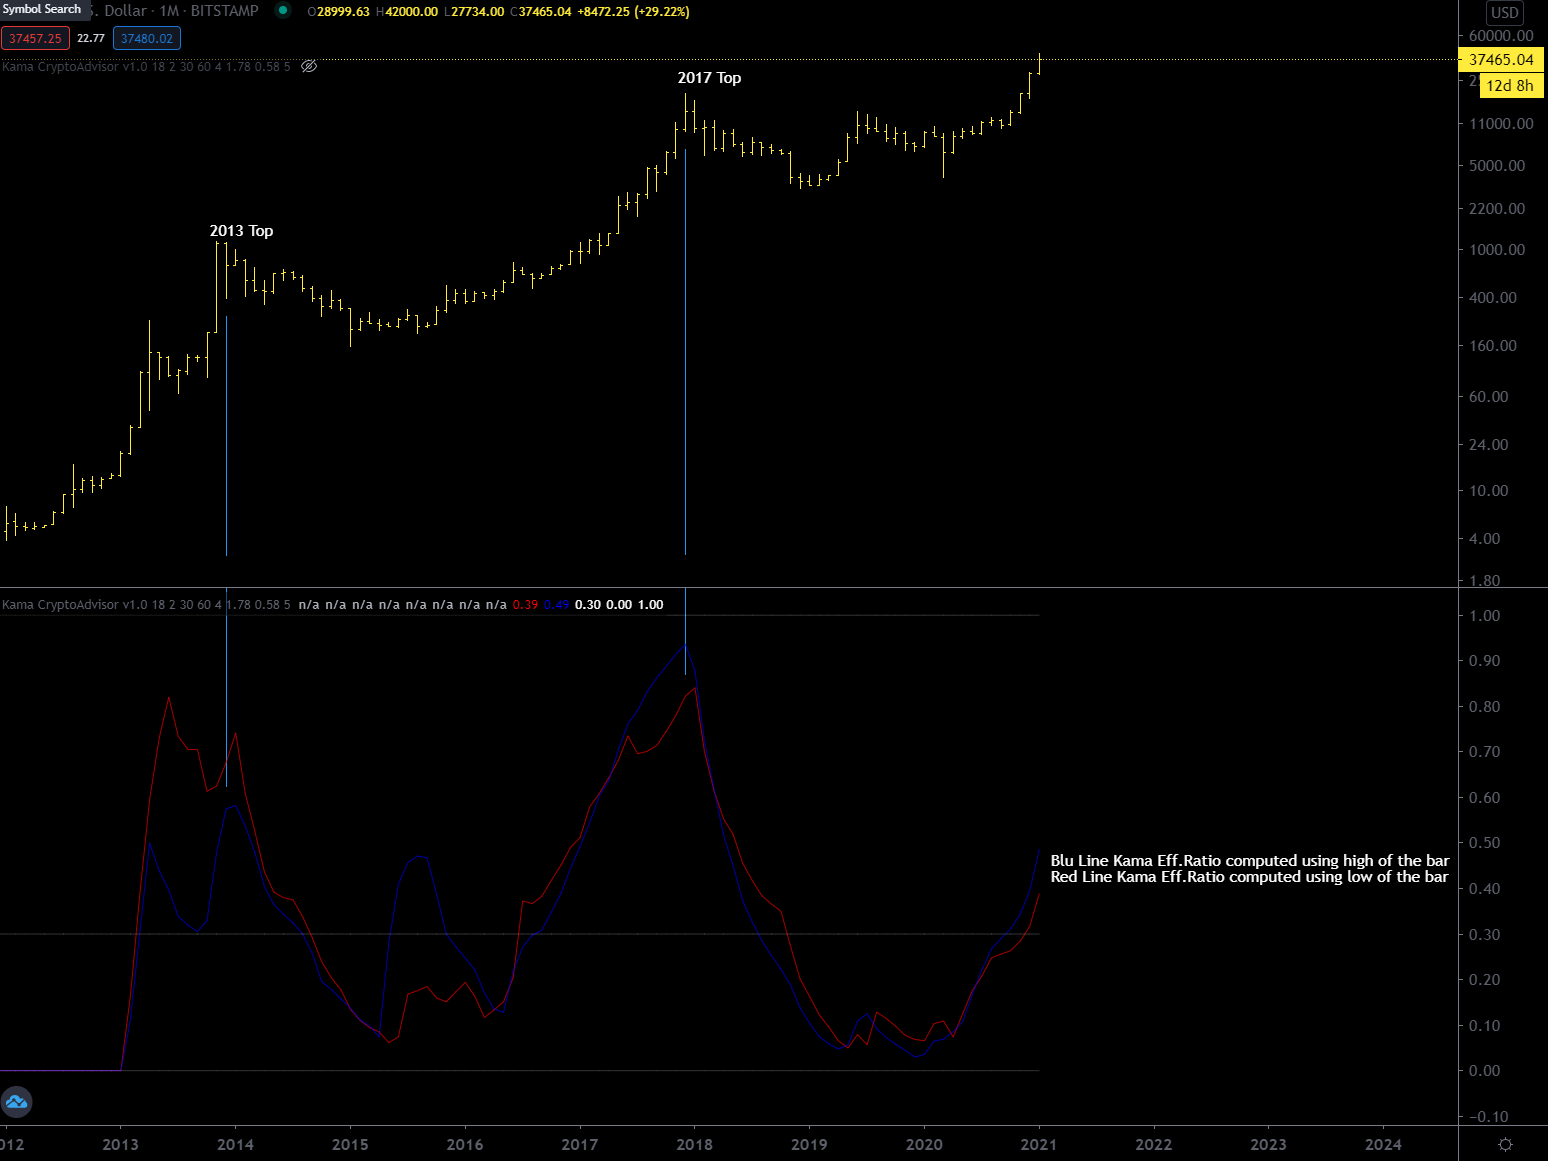
And here the monthly chart where you can clearly see there is room for a prolonged trend.
BTCUSD Monthly Chart with 18 periods Kama Efficiency Ratio
I always tell you guys that it is very important to evaluate the relationship between trend strength and volatility, it makes us understand if the market is in “trend mode” or “flat mode”, at the moment we are at the limits, the market has reacted from the support shown in the last update but it is not enough. In order to stay in “trend mode” it is now necessary to make a higher top than the previous one, perhaps around $46,000; any top lower then this would imply that BTCUSD is slowing down and going FLAT.
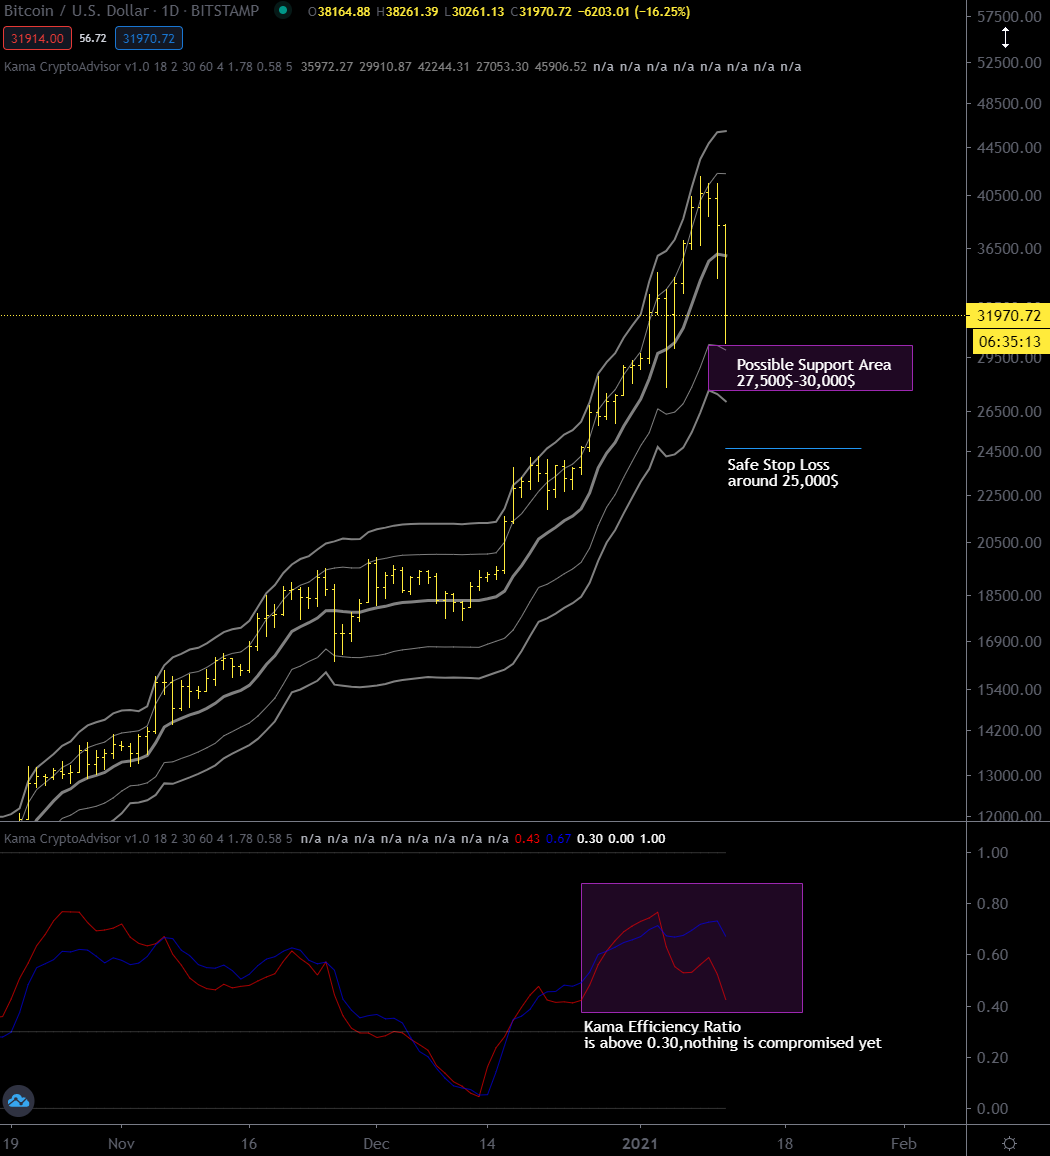
BTCUSD Daily Chart – Kama deviation bands and efficiency ratio on lower pane
When a security or an asset is in “trend mode” it is strategically optimal to keep the position in the direction of the trend without trying to go against by opening a short positions inside the deviation bands resistance area. If you really want to go short, enhance the efficiency of your initial stop-loss by pairing it with a trailing stop loss.
I didn’t expect such an intense drop, as a general rule when volatility increases you have to go up with the timeframe used, the 4 hour chart is not enough anymore. On the daily chart a correction below $30,000 would mean that an intermediary top has been made at $42,000 and that a more or less prolonged sideways movement awaits us before seeing new highs. I am including below an updated daily chart.
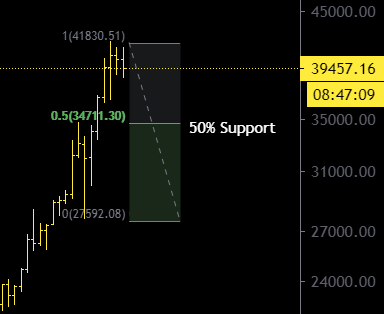
After a strong rise from $27,000 to $42,000 I think it is time for a break, in these situations sometimes the simplest approach is the valid one. The most obvious support is the 50% of the range at around 34,800$.
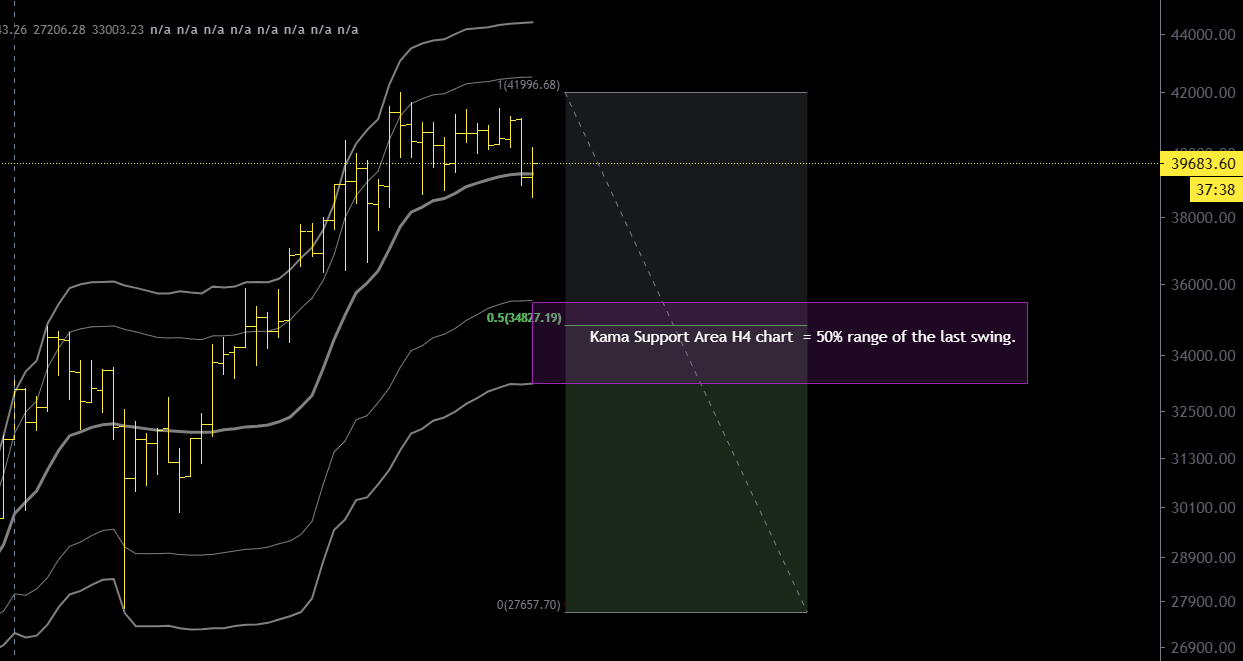
The closest dynamic support are the deviation bands of the kama average on the 4 hour timeframe.
I’m not saying that BTCUSD will go there, it could be an opportunity to buy if this scenario materializes. Don’t forget that when the market is fast you can lower the timeframe to find better support areas, as you can see in the above chart KAMA deviation bands worked well during the sell-off down to 27,000$ last January 4. Under these circumstances the daily chart is too slow to adapt.
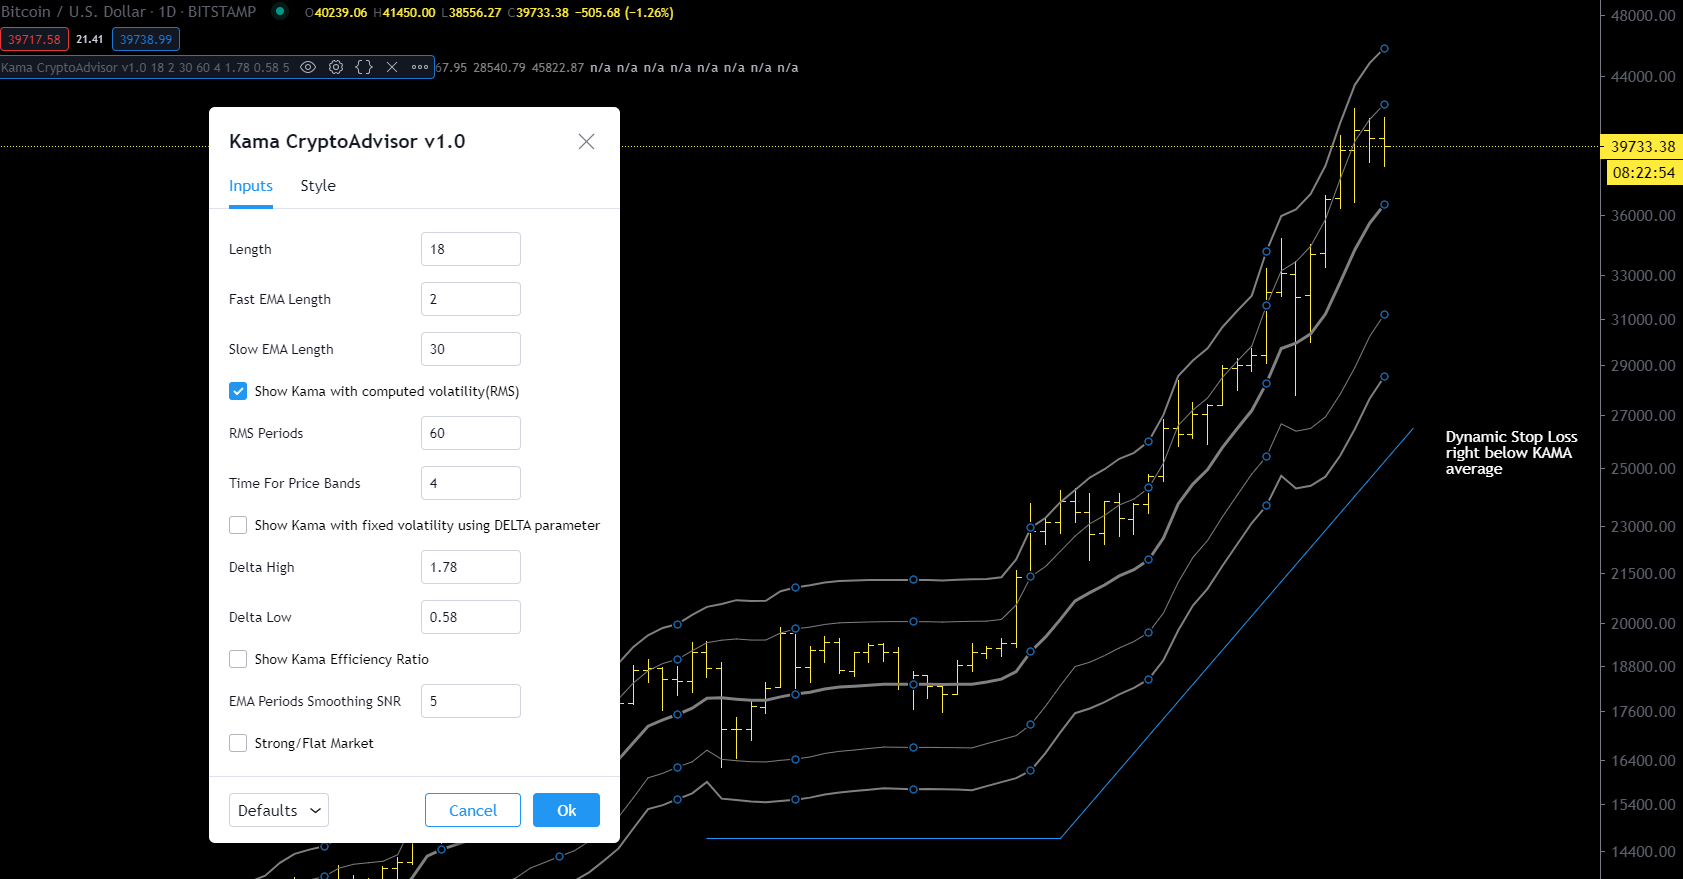
You often ask me when to enter a trend already started, usually it is never too late to buy the important thing is to place a stop that is beyond the deviation bands that I use, to stay safe from volatility.
Let’s see an example on the daily chart.
BTCUSD Daily Chart with kama average and an ideal dynamic stoploss – KAMA parameters that i use are included.
You can buy at any moment a well established trend but keep in mind that the right stoploss to use is wide, not tight because Bitcoin volatility is high. If you don’t like KAMA average and the way i compute bands you can give a try to Keltner Channels. Personally i prefer the approach of Mr.Kaufman but the choice is yours.