This post is meant to be an addition to what I said earlier this year. Here we compare, in the same historical period of existence of bitcoin, Bitcoin vs other assets: us stock market indexes, US stocks of different sectors and Gold.
Let’s start with this summary table, who follow me regularly should already know the meaning of Shannon’s probability, RMS, G yield and compounded annual G yield; for all the others I refer you to the end of the article.
The data have been sorted in descending order according to Compounded Yearly Gain G.
Comparison Bitcoin vs. The rest of the world
July 17, 2010 – Dec 31, 2019
| Asset | RMS or Volatility | Shannon Probability P | Daily Gain G | Compounded Yearly Gain G | Optimal Fraction of your capital to wage |
| Bitcoin | 0.0567 | 0.5219 | 1.00087 | 38% | 4.4% |
| MasterCard | 0.0155 | 0.5265 | 1.0007 | 19% | 5.3% |
| Visa | 0.0144 | 0.5241 | 1.0006 | 16% | 4.8% |
| Amazon | 0.0193 | 0.5196 | 1.00057 | 15% | 3.9% |
| Apple | 0.0161 | 0.5172 | 1.00042 | 11% | 3.4% |
| 0.0148 | 0.5167 | 1.00038 | 10% | 3.3% | |
| Microsoft | 0.0143 | 0.5169 | 1.00038 | 10% | 3.4% |
| Nasdaq Composite Index | 0.0106 | 0.5179 | 1.00032 | 8% | 3.6% |
| Standard & Poor’s 500 Index | 0.0091 | 0.5160 | 1.00025 | 6% | 3.2% |
| McDonald | 0.0098 | 0.5119 | 1.00019 | 5% | 2.4% |
| Berkshire Hathaway Inc. (W.Buffett) | 0.0105 | 0.5112 | 1.00018 | 5% | 2.2% |
| Pfizer | 0.0115 | 0.5078 | 1.00011 | 3% | 1.6% |
| 0.0226 | 0.5080 | 1.00010 | 3% | 1.6% | |
| Tesla | 0.0318 | 0.5096 | 1.00010 | 3% | 1.9% |
| JPMorgan | 0.0155 | 0.5070 | 1.00010 | 2% | 1.4% |
| Intel | 0.0153 | 0.5040 | 1.00001 | 0% | 0.8% |
| **Gold (XAUUSD) | 0.0094 | 0.4951 | 0.99986 | -3% | 0% |
| *Ethereum | 0.0634 | 0.5138 | 0.99974 | -6% | 0% |
| General Motors | 0.0178 | 0.4903 | 0.99950 | -12% | 0% |
| General Electric | 0.0164 | 0.4868 | 0.99943 | -13% | 0% |
*Ethereum Data since Aug 7, 2015, source coinmarketcap.
**Gold since 1970 has been a bit better with +3% yearly compounded gain.
The first comparison to make is with the main competitors of bitcoin, credit cards. I’m surprised to see how good are quantitative parameters of Mastercard and Visa, on the other hand they are monopolies, perhaps that’s why the CEO of mastercard hates so much Bitcoin, he sees it as a strong threat. Even Amazon has worse parameters compared to Visa and MC.
I included only Ethereum in the comparison because in terms of market cap is second to Bitcoin, its yearly yield G is negative and i’m not surprised because I remind you that volatility reduces by far the yield G and in the case of all altcoins, not only Ethereum, the volatility reaches very high levels and therefore as an investment vehicle altcoins in general are absolutely not recommended, can eventually be considered as purely speculative assets for short-term trading.
Unfortunately for Mr.P.Schiff, in the last ten years Gold performed badly, for your curiosity i computed Gold parameters using available daily data since January 1970 and its yearly gain G or yield has been +3%, nothing exceptional, basically Gold protected you against inflation in the last fifty years but nothing more then this.
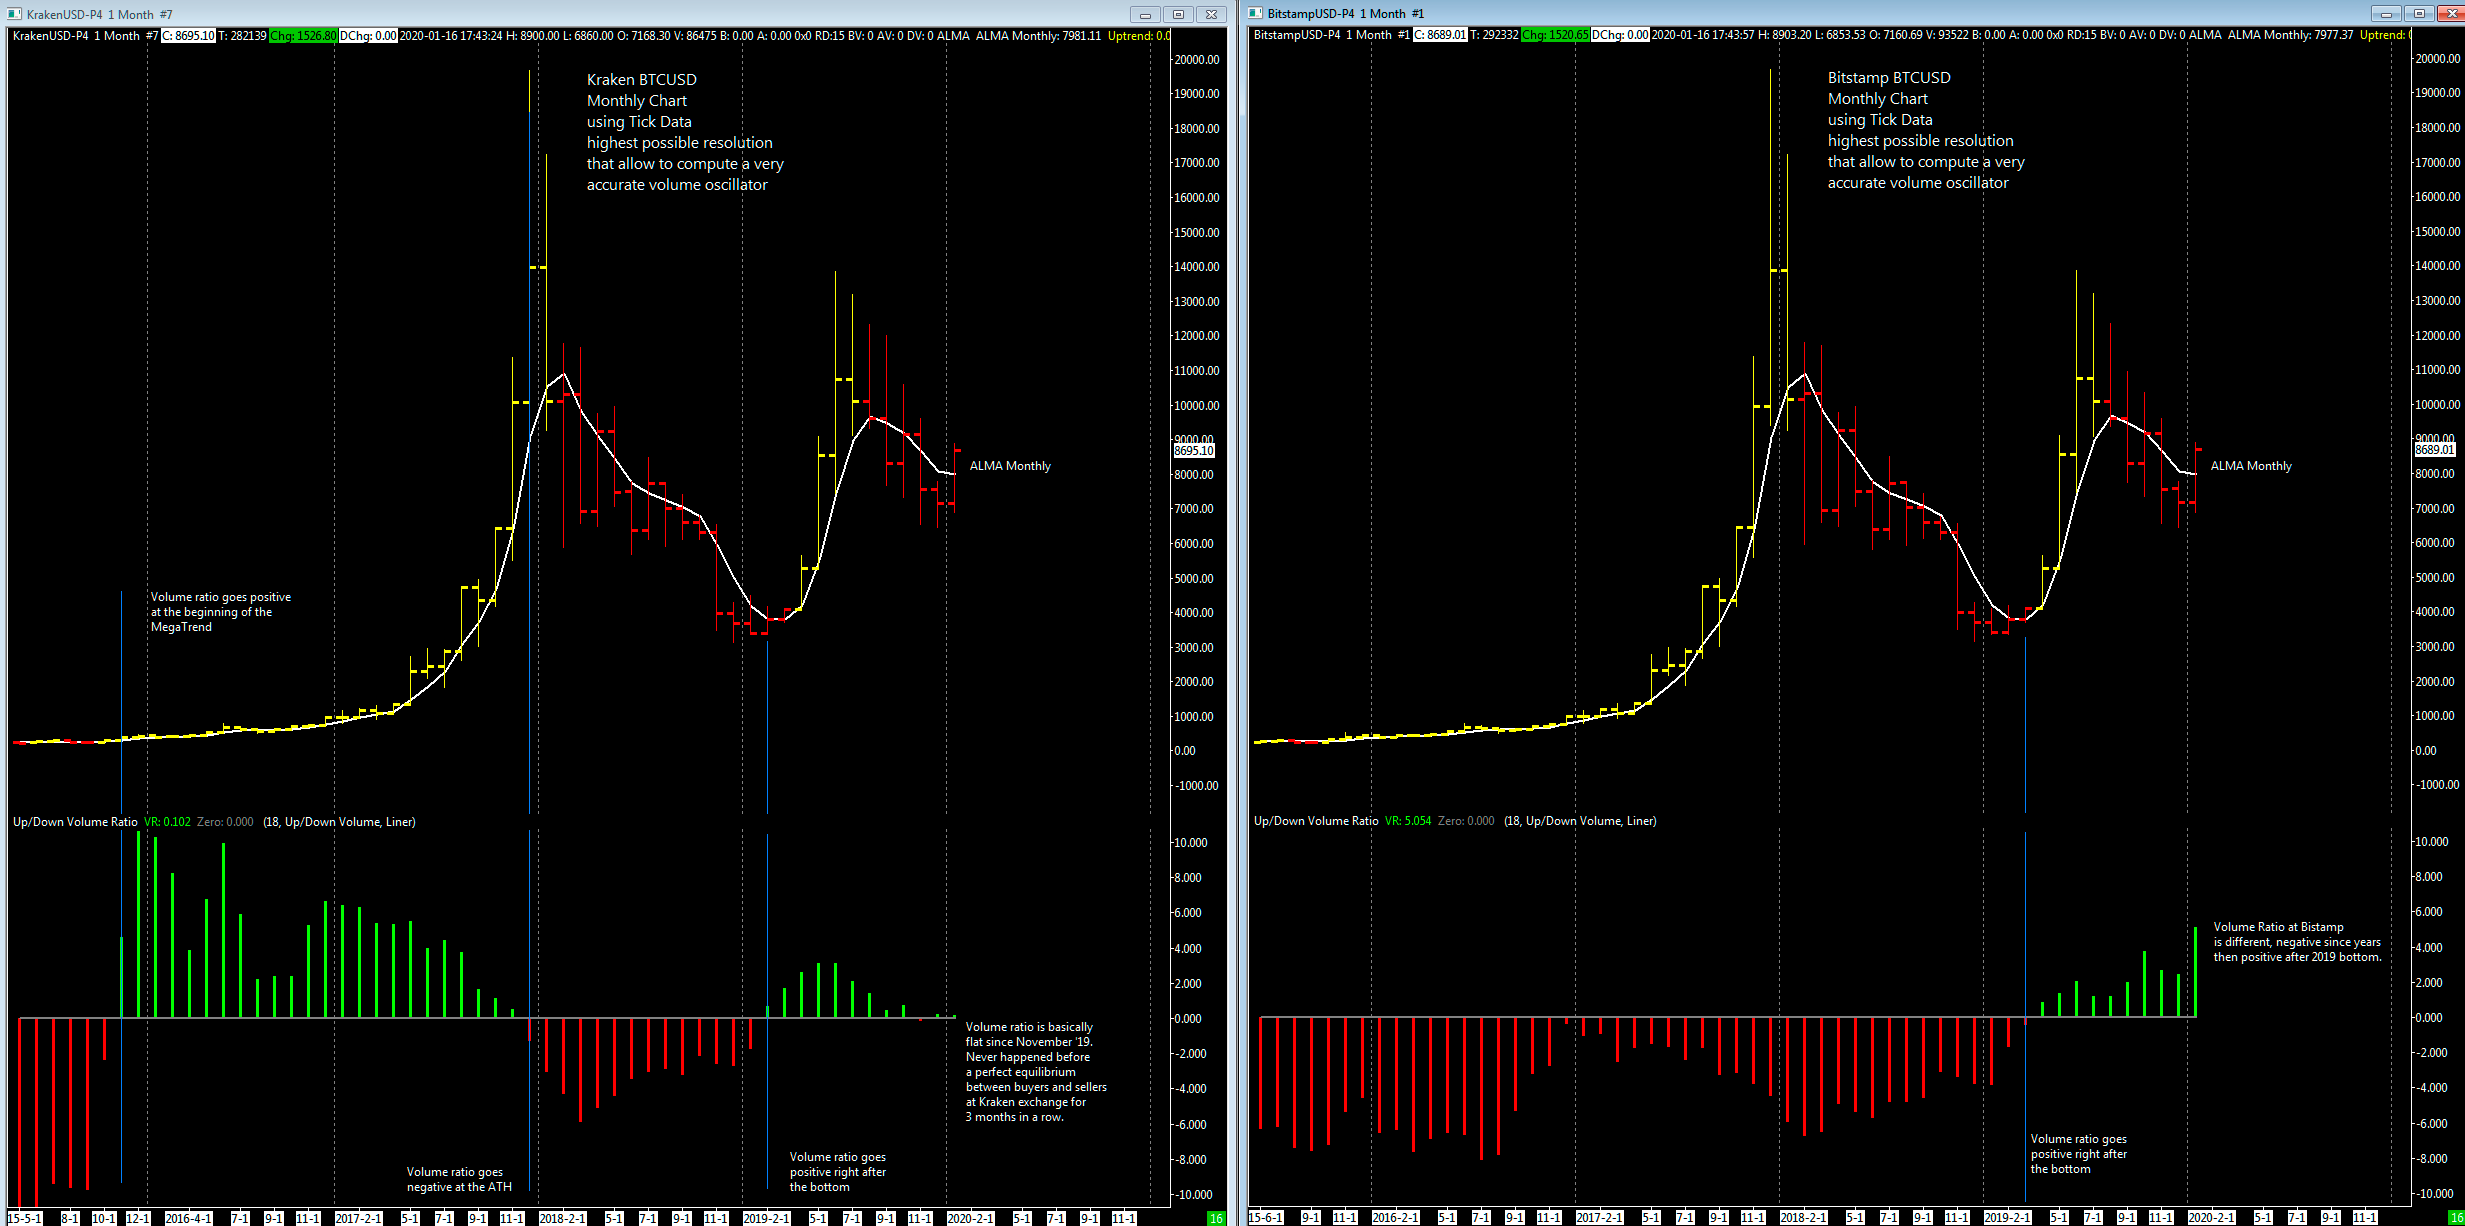
As i said 20 days ago Bitcoin volatility is dropping but it remains very high compared to other assets, despite this Bitcoin yearly compounded gain G is an astonishing +38% and it’s the best investment vehicle of the world.
Compared to other bitcoin price models this value is not much, ten years from now compounding 38% yearly bitcoin should be at around 200k usd while, for example, the stock to flow model has a forecast of 10 millions usd after 2028 halving, this is the equivalent of 144% yearly compounded gain instead of 38%.
Let me know what you think, does the stock to flow model price return appear realistic to you or not? Personally i prefer to rely on numbers and they say a clear “no” to me. This is why i’m a bit skeptic about also the bitcoin price model i developed on tradingview but i’m curious to see how it’ll end in a couple of years.
Tech Addendum
The concept of entropic analysis of equity prices is old and it was first proposed by Louis Bachelier in his “theory of speculation”, this thesis anticipated many of the mathematical discoveries made later by Wiener and Markov underlying the importance of these ideas in today’s financial markets. Then in the mid 1940’s we have had the information theory developed by Claude Shannon , theory that is applicable to the analysis and optimization of speculative endeavors and it is exactly what i’ve done just applied to bitcoin and the other assets considered in the above table, especially using the Shannon Probability or entropy that in terms of information theory, entropy is considered to be a measure of the uncertainty in a message.
To put it intuitively, suppose  , at this probability, the event is certain never to occur, and so there is no uncertainty at all, leading to an entropy of 0; at the same time if
  the result is again certain, so the entropy is 0 here as well. When
  or 0.50 the uncertainty is at a maximum or basically there is no information and only noise.
Applying this entropy concept to an equity like a stock or a commodity or even bitcoin itself common values for P are 0.52 that can be interpreted as a slightly persistence or tendency to go up, this means that for example stock markets aren’t totally random and up to some extend they are exploitable, same for btc.
Knowing the entropy level of bitcoin/usd is crucial if we want to compute its main quantitative characteristics, as i explained in the technical background of my blog this process is quickly doable once you have all the formulas, the process is as follows:
To compute the Shannon Probability P you should follow these steps:
- compute natural logarithm of data increments (today price / yesterday price)
- compute the mean for all data increment computed in step 1
- compute RMS (root mean square) of all data increments, squaring each data increment and sum all togheter
- Compute price momentum probability with the formula P = (((avg / rms) – (1 / sqrt (n))) + 1) / 2
where avg = data computed in step 2, rms = data computed in step 3, n = total samples of your dataset. If the resulting probability is above 0.5 then there is positive momentum, otherwise under 0.5 negative momentum
To compute the Gain Factor G use the following formula:
| G = ((1+RMS)^P*((1-RMS)^(1-P)) |
To compute the yearly gain G or growth just raise daily gain G to the 365th power for Bitcon or 252 for stocks (252 trading days in a year).