
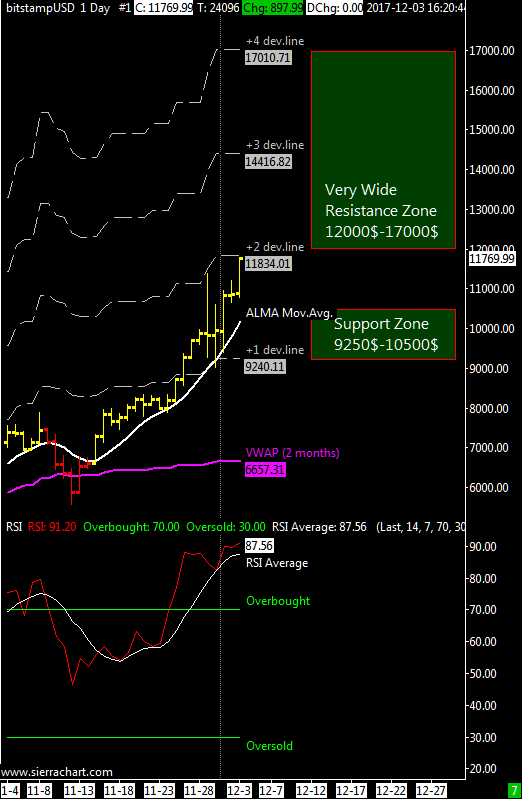
XBT/USD weekly price range 10500$-14400$ | The resistance zone for this week is very wide and ranges from 12000$ to 17000$ and is defined by the 2nd and 4th deviation line, we start the week again near a resistance but I think it is possible to reach 14400$ with a maximum peak at 17000$ eventually the week later near the CME bitcoin futures debut.
To compensate for higher levels of volatility I have increased the coefficients to calculate the various levels of VWAP price deviation lines so as to have greater consistency with other indicators that I use to compute volatility, supports and resistances; all this to ensure a good correlation between the different approaches I use.
We are very unbalanced to the upside and I don’t expect significant declines for this reason the support area is more narrow and ranges from 9250 to 10500 dollars just above the 1st deviation line.
The RSI oscillator is always clearly overbought with its average being saturated well above the threshold level of 70; these two conditions do not preclude a further push of the market at $14000 and until I see a slowdown on the weekly chart I will continue to ignore this oscillator.
