
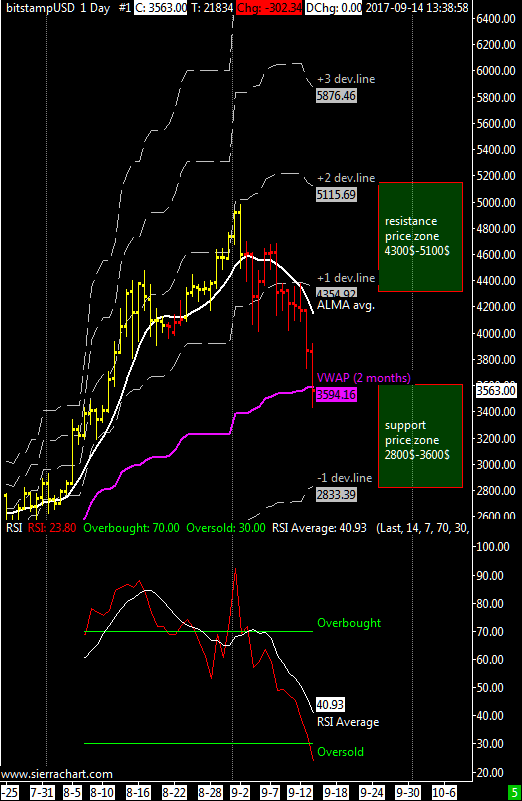
Updated weekly range is 2800$-4300$ | For the first time in many months the XBTUSD cross is testing the VWAP volume average calculated using the last two months of daily data.
This is certainly a sign of a slowdown in the current upward trend, it is important to see how long prices will remain around the VWAP average, which today stands at around $3600, a quickly reaction to the upside from here would mean that this market is still very strong and resilient to all attacks it is receiving since September.
From here to Sunday there could also be a quick visit to the first negative deviation line located at 2800$ but looking at the weekly chart there seems to be room for a minimum in October around $2500, in any case later this month I will publish a long term update to better understand where we might have the next medium term bottom using the weekly chart and not the daily chart more suitable for short-term price movements. This mid-term bottom must be ABOVE the previous one of 1800$ happened in July ’17 in order to mantain a sequence of higher highs and higher lows.
The RSI oscillator enters the oversold zone after several weeks with its average just above the oversold threshold located at 30, this may mean that a short rebound of few days is ahead, typical after abrupt downward movements.
Overall I think that the XBTUSD cross can hardly lose more than 50% of its value in a single movement, this would mean strong support at $2500.

Hi Enky,
I was reading your analysis and thinking about if I should sell my BTC now. I will take some pretty heavy losses, but I will buy BTC again when the BTC price crashed down to 2500 USD. This will enable me to recover my losses.
What do you think, what is the best stregy to mitigate losses on the short term?
Thanks,
Fritz